How to Check Engagement Rate of Any Influencer on Instagram (2026 Guide)
Engagement rate is one of the most important metrics for evaluating Instagram influencers. This guide shows how to calculate it, compare results, and identify creators with active and engaged audiences.
.png)

How to Check Engagement Rate of Any Influencer on Instagram
Instagram has over two billion monthly active users. The average brand partnership involves a creator with tens of thousands of followers. And yet, follower count alone has almost no correlation with whether a campaign will perform.
Engagement rate is the metric that fills that gap. It tells you what percentage of a creator's audience actually interacts with their content — and on Instagram specifically, it varies significantly depending on the creator's size, content format, and posting consistency. A number that looks great on a macro-influencer profile would be a red flag on a nano-creator's page.
This guide gives you the Instagram-specific engagement rate formula, benchmark data by creator tier and content format, three practical methods to check any account, a step-by-step walkthrough using Favikon V3's analytics dashboard, and a red flag checklist for spotting inflated or inauthentic engagement — so every creator evaluation starts from data, not guesswork.
1. Why Instagram Engagement Rate Is Your Primary Vetting Signal
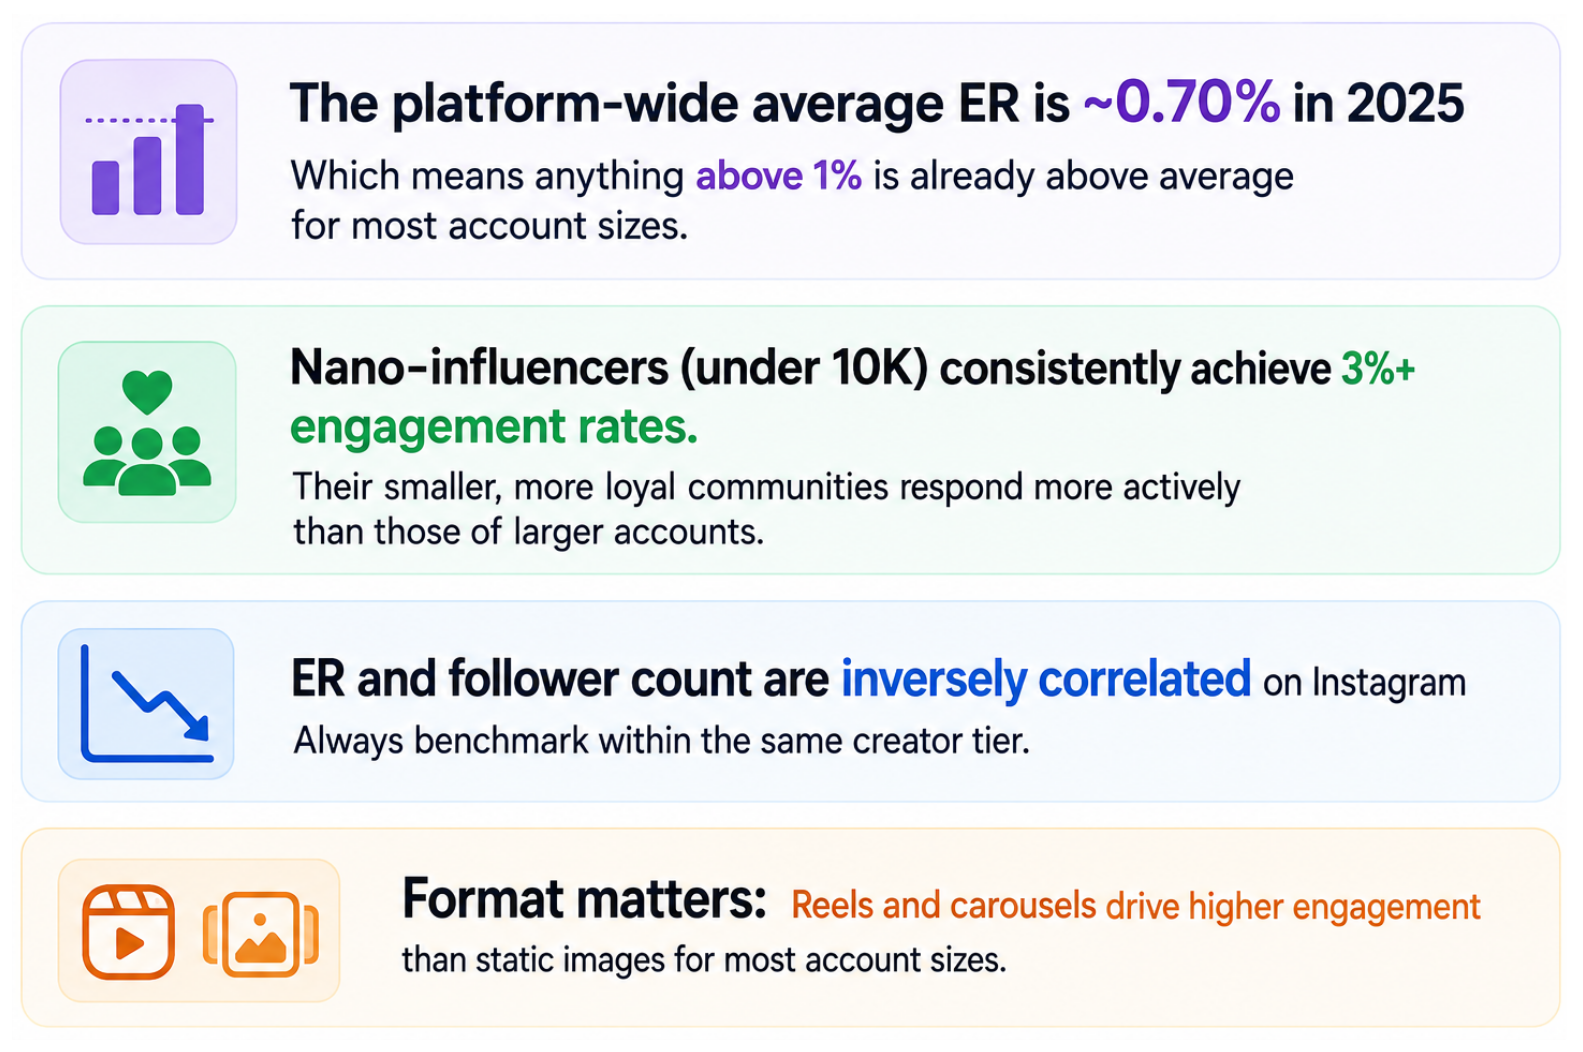
Instagram's average engagement rate across all account sizes sat at approximately 0.70% in 2025 — a significant decline from prior years and a direct reflection of the platform's growing content volume, algorithm shifts toward Reels, and the normalization of purchased follower inflation.
This declining baseline makes engagement rate more important, not less. When the average is low, creators who maintain strong engagement are measurably outperforming the platform norm. Those are the partnerships worth paying for.
What Instagram Engagement Rate Actually Predicts
• Audience responsiveness: Does this creator's audience take action when they post, or just scroll past?
• Content-audience fit: Is the creator producing content their followers genuinely connect with?
• Recommendation trust: An audience that consistently engages with a creator's content is more likely to trust and act on their brand recommendations
• Campaign conversion potential: High engagement correlates with higher click-through and purchase rates from sponsored content
📊 Instagram ER: The key context
2. The Instagram Engagement Rate Formula
Instagram engagement rate is calculated using the same core formula as other platforms, but with a specific set of actions that count as engagements:
Instagram Engagement Rate (Standard — by Followers)
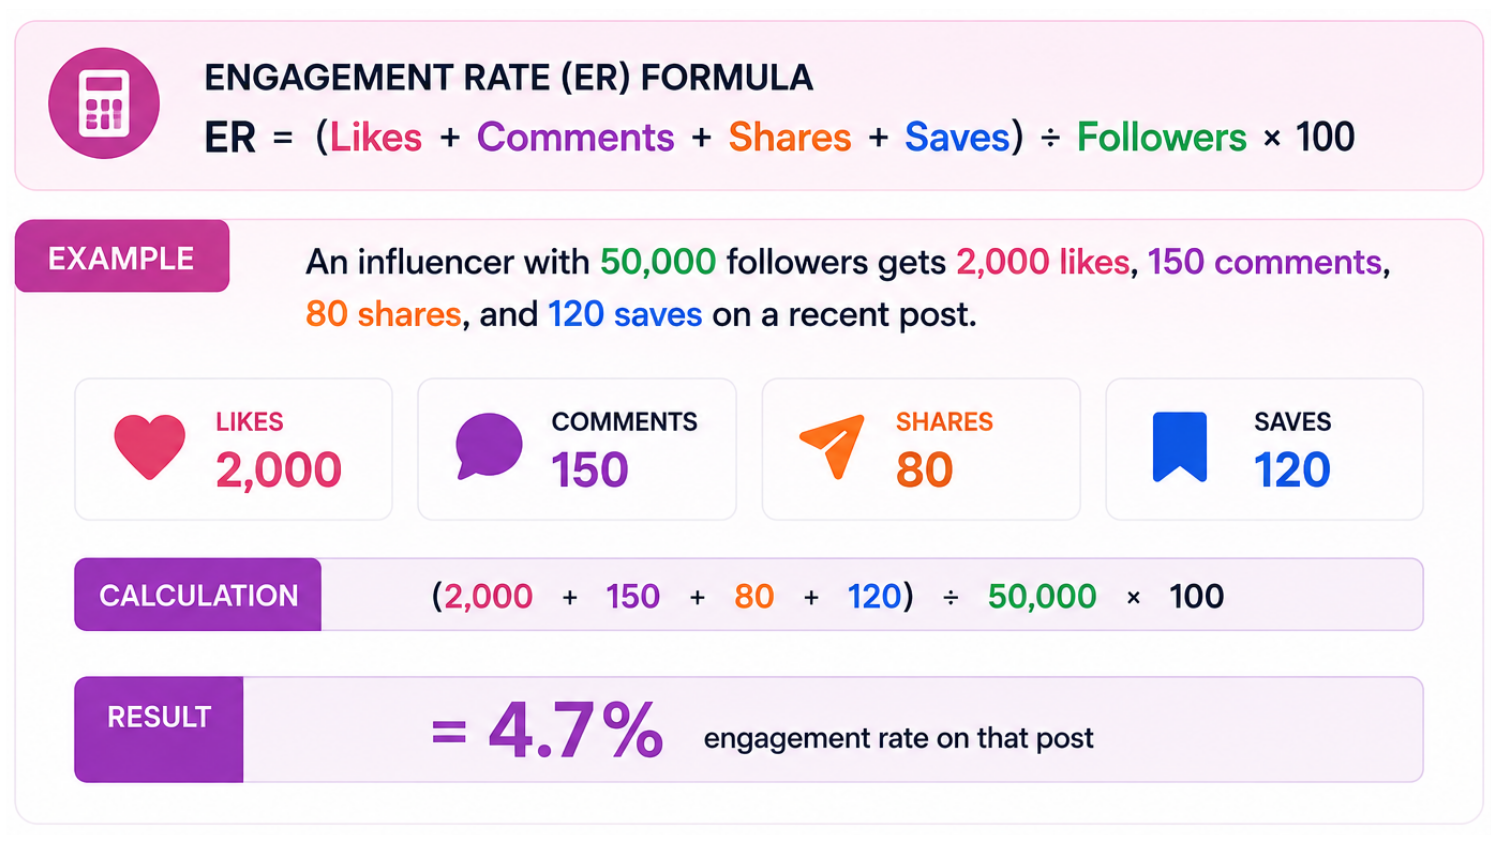
For an accurate picture, always average ER across 10–20 recent posts, not just one. A single post can be inflated by a viral moment or suppressed by algorithm timing — neither is representative of the creator's ongoing performance.
ER by Reach: The More Accurate Internal Formula
If a creator shares their native Instagram Insights with you — for example, as part of a partnership negotiation — use this formula instead:
Instagram Engagement Rate (by Reach — internal view)
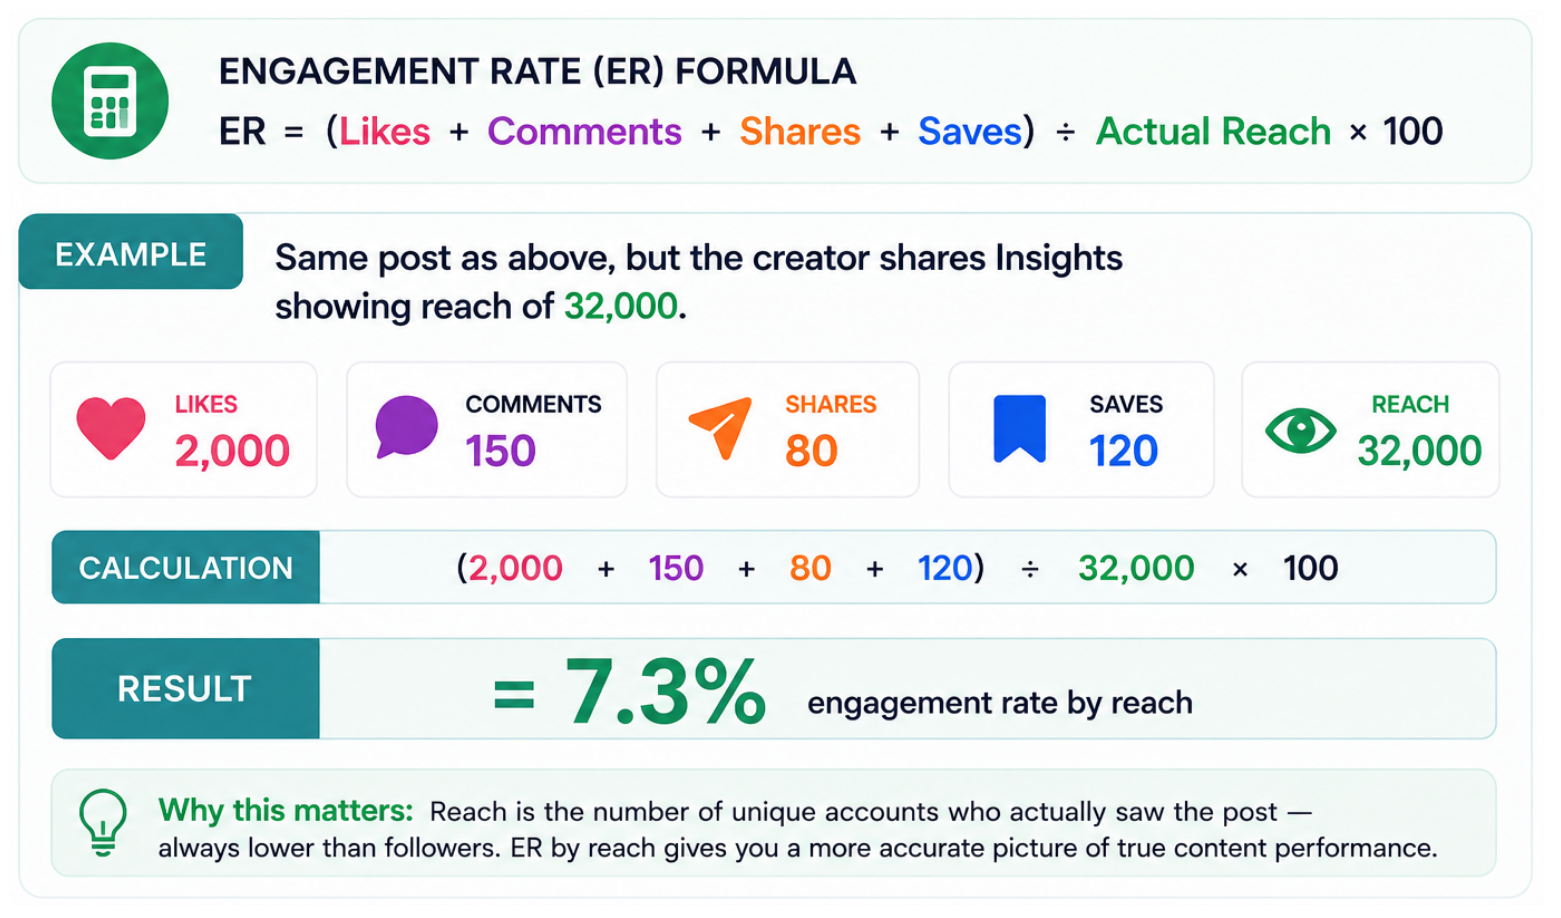
Reach-based ER is always higher than follower-based ER, because reach (unique accounts who saw the post) is always lower than total followers. For external creator vetting, always use the follower-based formula — it's consistent, comparable across creators, and what Favikon's analytics report by default.
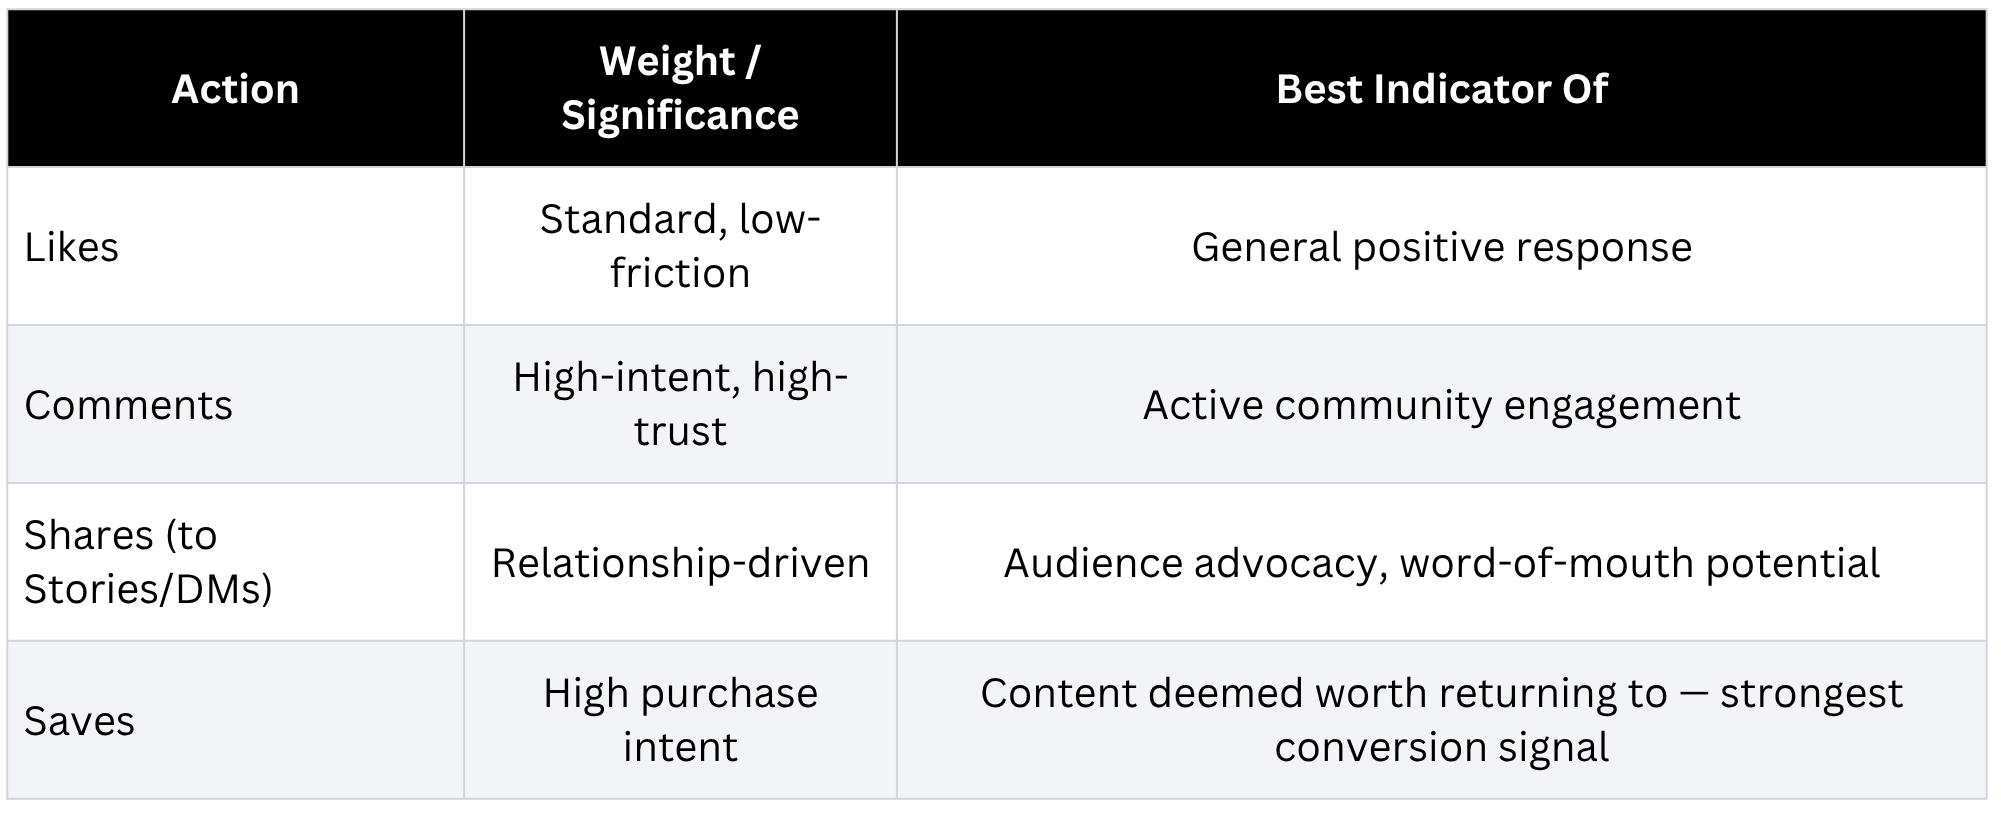
What Counts as Engagement on Instagram
Instagram's engagement ecosystem differs from other platforms in one important way: saves are a distinct high-intent action unique to Instagram. A save signals that a user found the content valuable enough to return to — it's arguably the strongest purchase-intent signal on the platform.
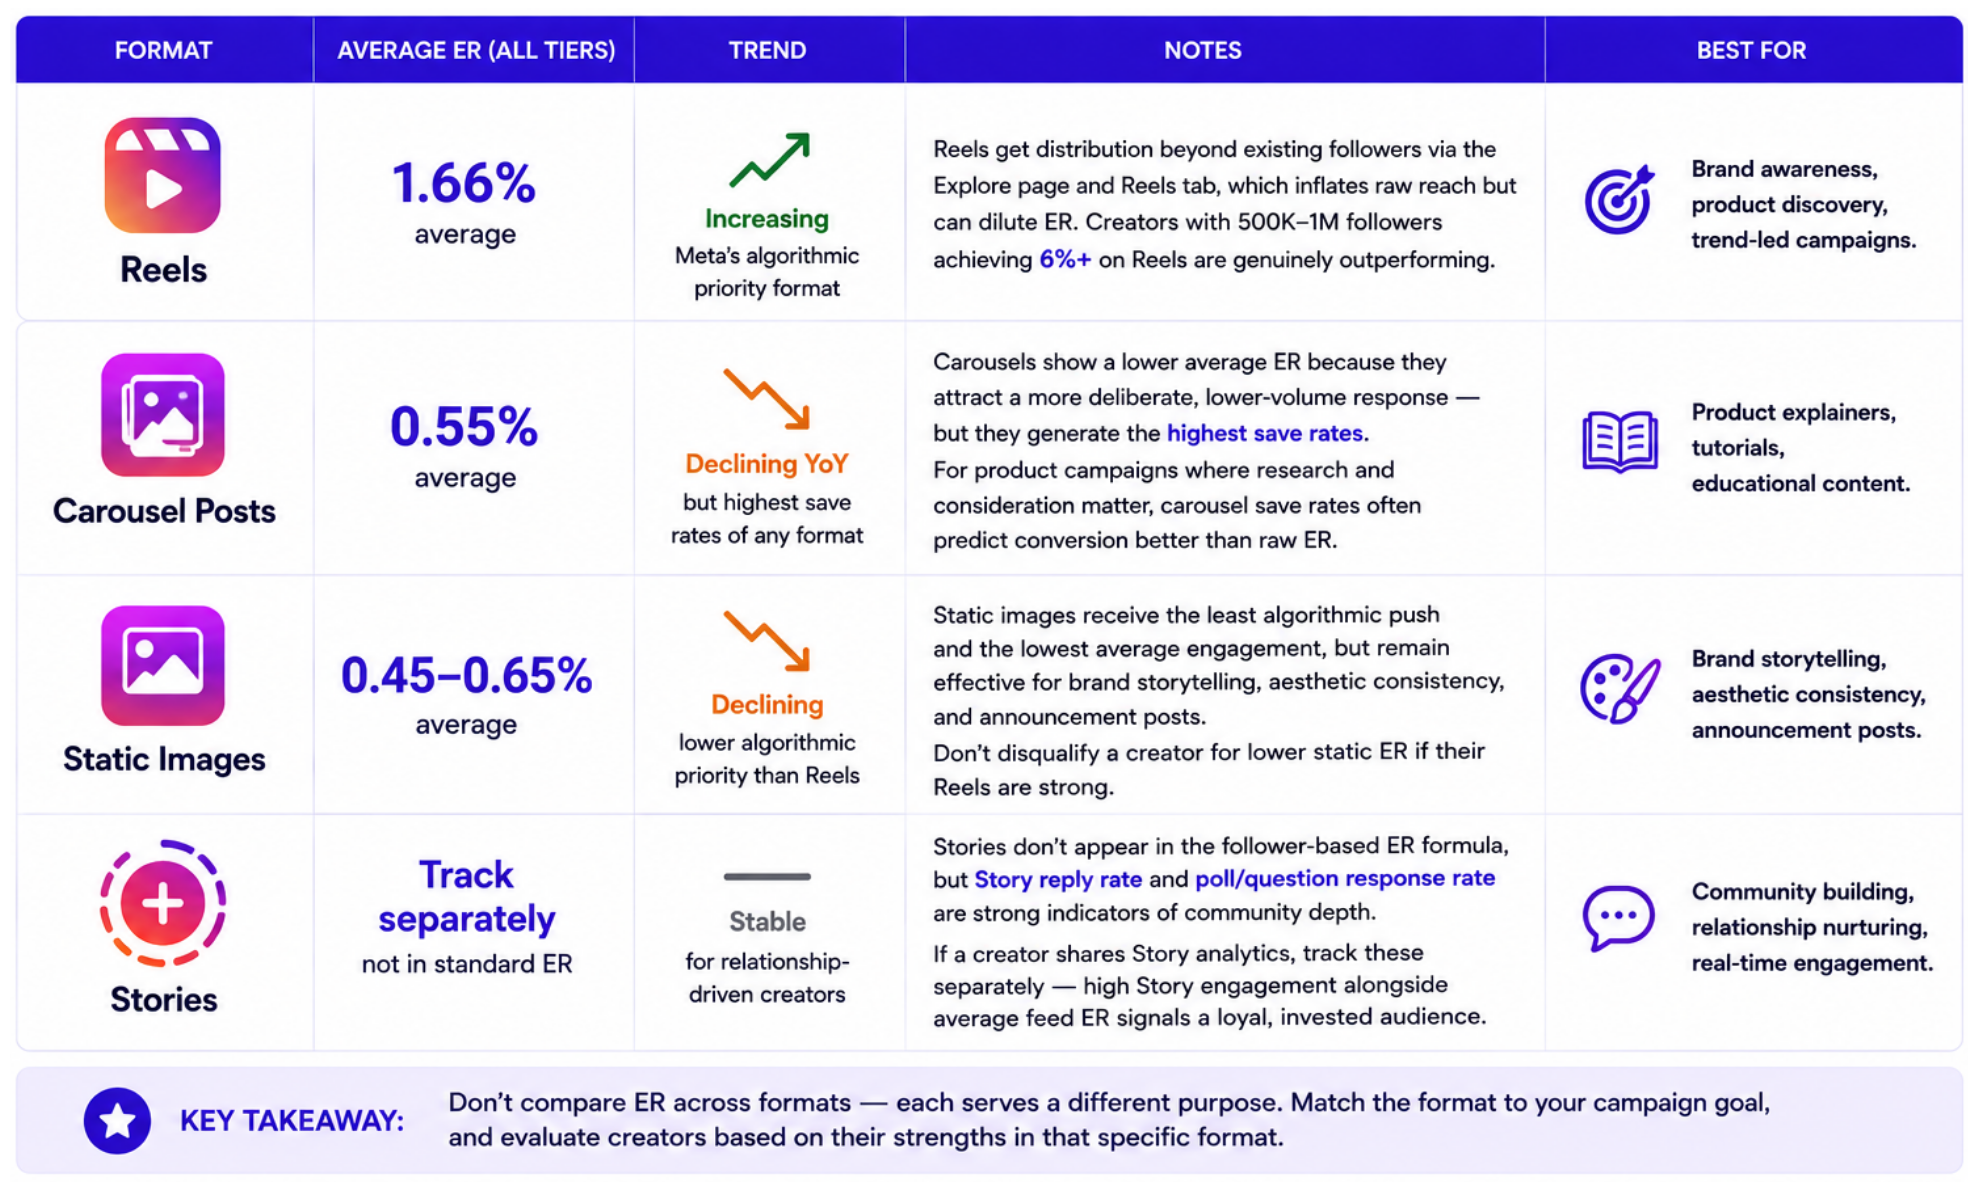
3. Instagram ER by Content Format — Why Format Changes Everything
Instagram's average engagement rate looks very different depending on which content format you're measuring. A creator posting exclusively Reels will have a naturally different ER profile than one who posts primarily static images — and evaluating them using the same benchmark would produce misleading conclusions.
4. Instagram Engagement Rate Benchmarks by Creator Tier
Use this table to evaluate where a creator's ER sits relative to others of the same size. These benchmarks are drawn from Favikon's 2025 Engagement Rate Benchmark Report, which analyzed over 600,000 active Instagram profiles. Remember: always compare within the same tier.
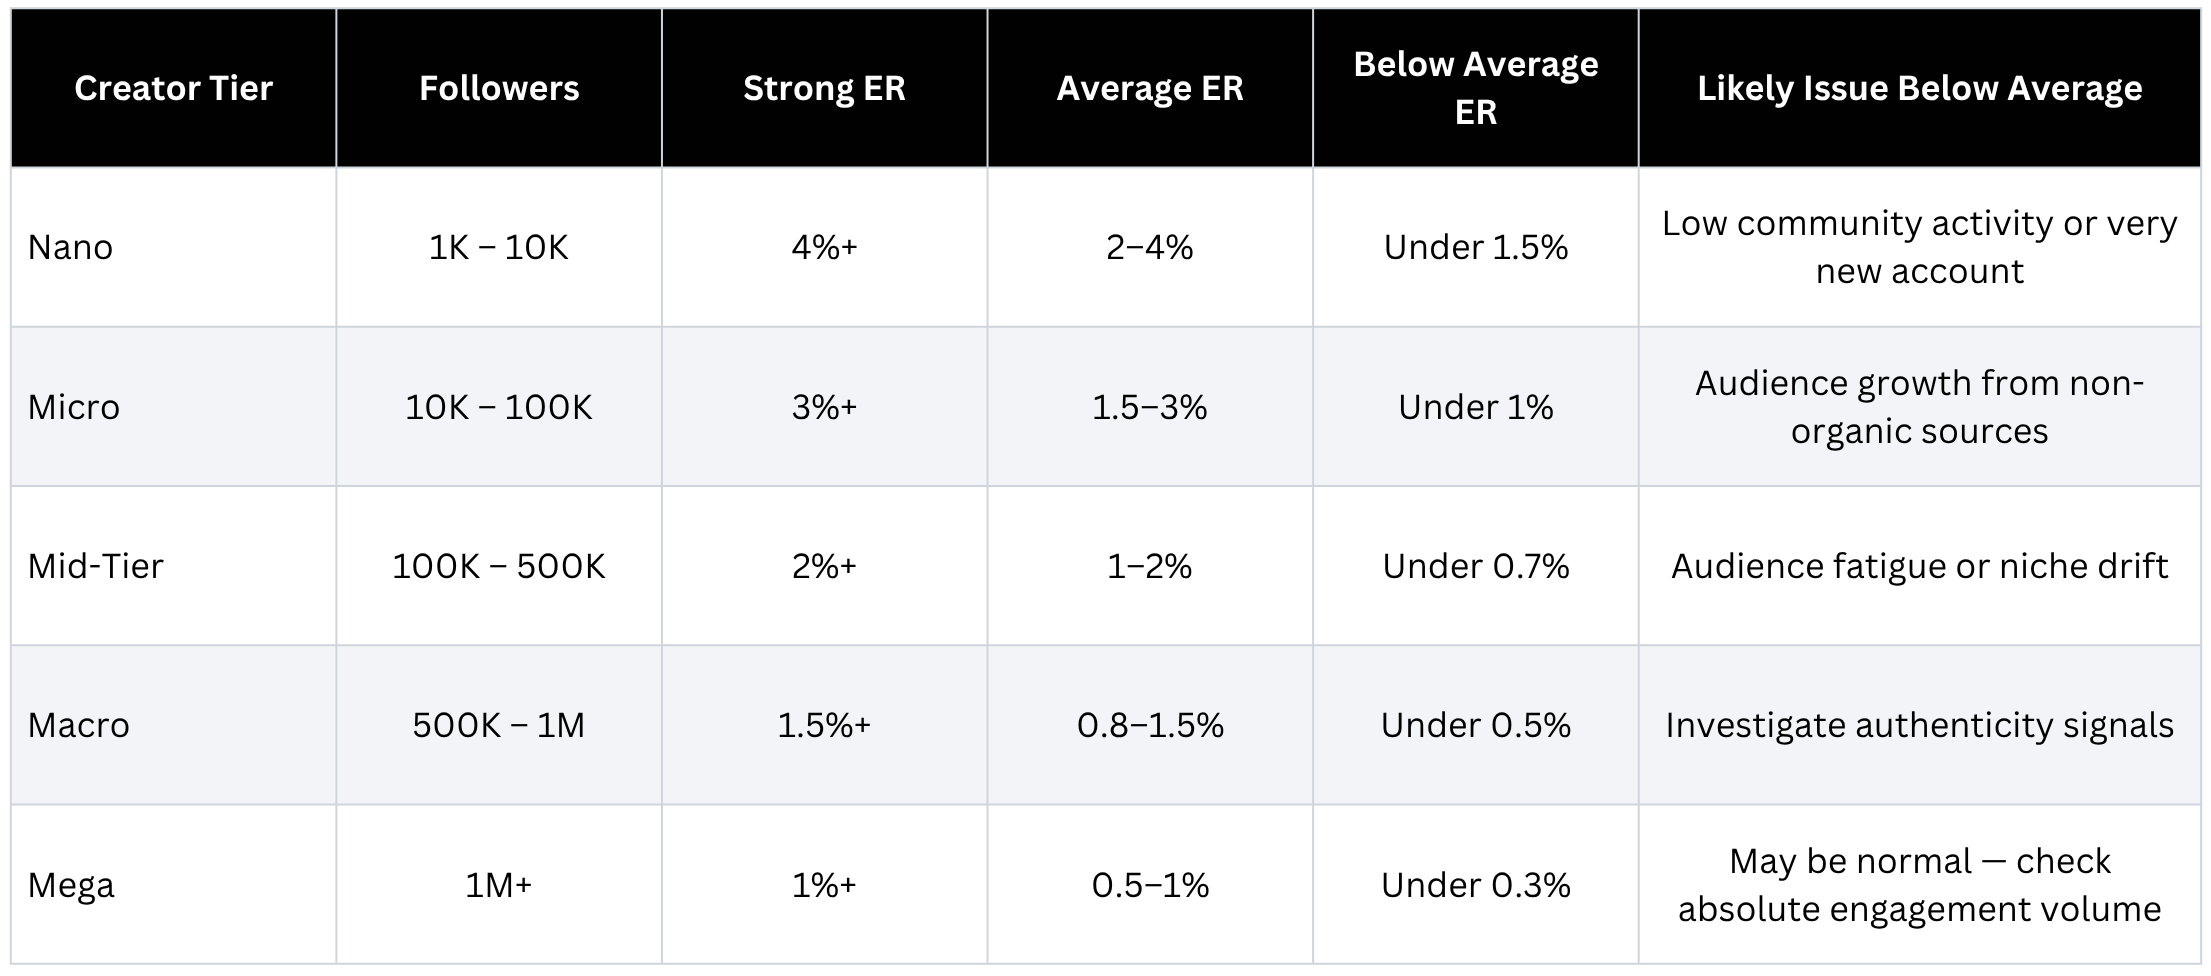
⚠️ Critical reminder: A mega-influencer at 0.6% is operating within normal range. A micro-influencer at 0.6% has a significant problem. Never compare ER across tiers — the inverse relationship between follower count and ER is a structural feature of the platform, not a performance signal.
5. Three Ways to Check an Instagram Influencer's Engagement Rate
Method 1: Favikon V3 — Recommended

Favikon V3 calculates and displays Instagram engagement rate automatically for any creator in its database. Open any creator profile in Favikon's analytics platform and you'll immediately see:
• Average ER across recent posts, displayed as a percentage with a quality score out of 100
• Quartile ranking — whether the creator is in the top 25%, 50%, or 75% of creators their size on Instagram
• A 30-day and 90-day ER trend chart, so you can see whether engagement is growing, stable, or declining
• Per-post ER breakdown for recent content — helps spot outliers and evaluate format consistency
• Authenticity score alongside ER, flagging engagement pod activity or purchased interactions
• Content tracking by date range — evaluate ER during a specific campaign window or custom period
The Favikon Chrome Extension surfaces this data directly on any creator's Instagram profile page in real time — no need to switch platforms during browsing.
Method 2: Favikon Free Engagement Rate Calculator
For a quick one-off calculation without opening the full analytics platform, Favikon's free Engagement Rate Calculator lets you input raw numbers (likes, comments, shares, saves, follower count) and instantly receive an ER calculation in both follower-based and reach-based formats.
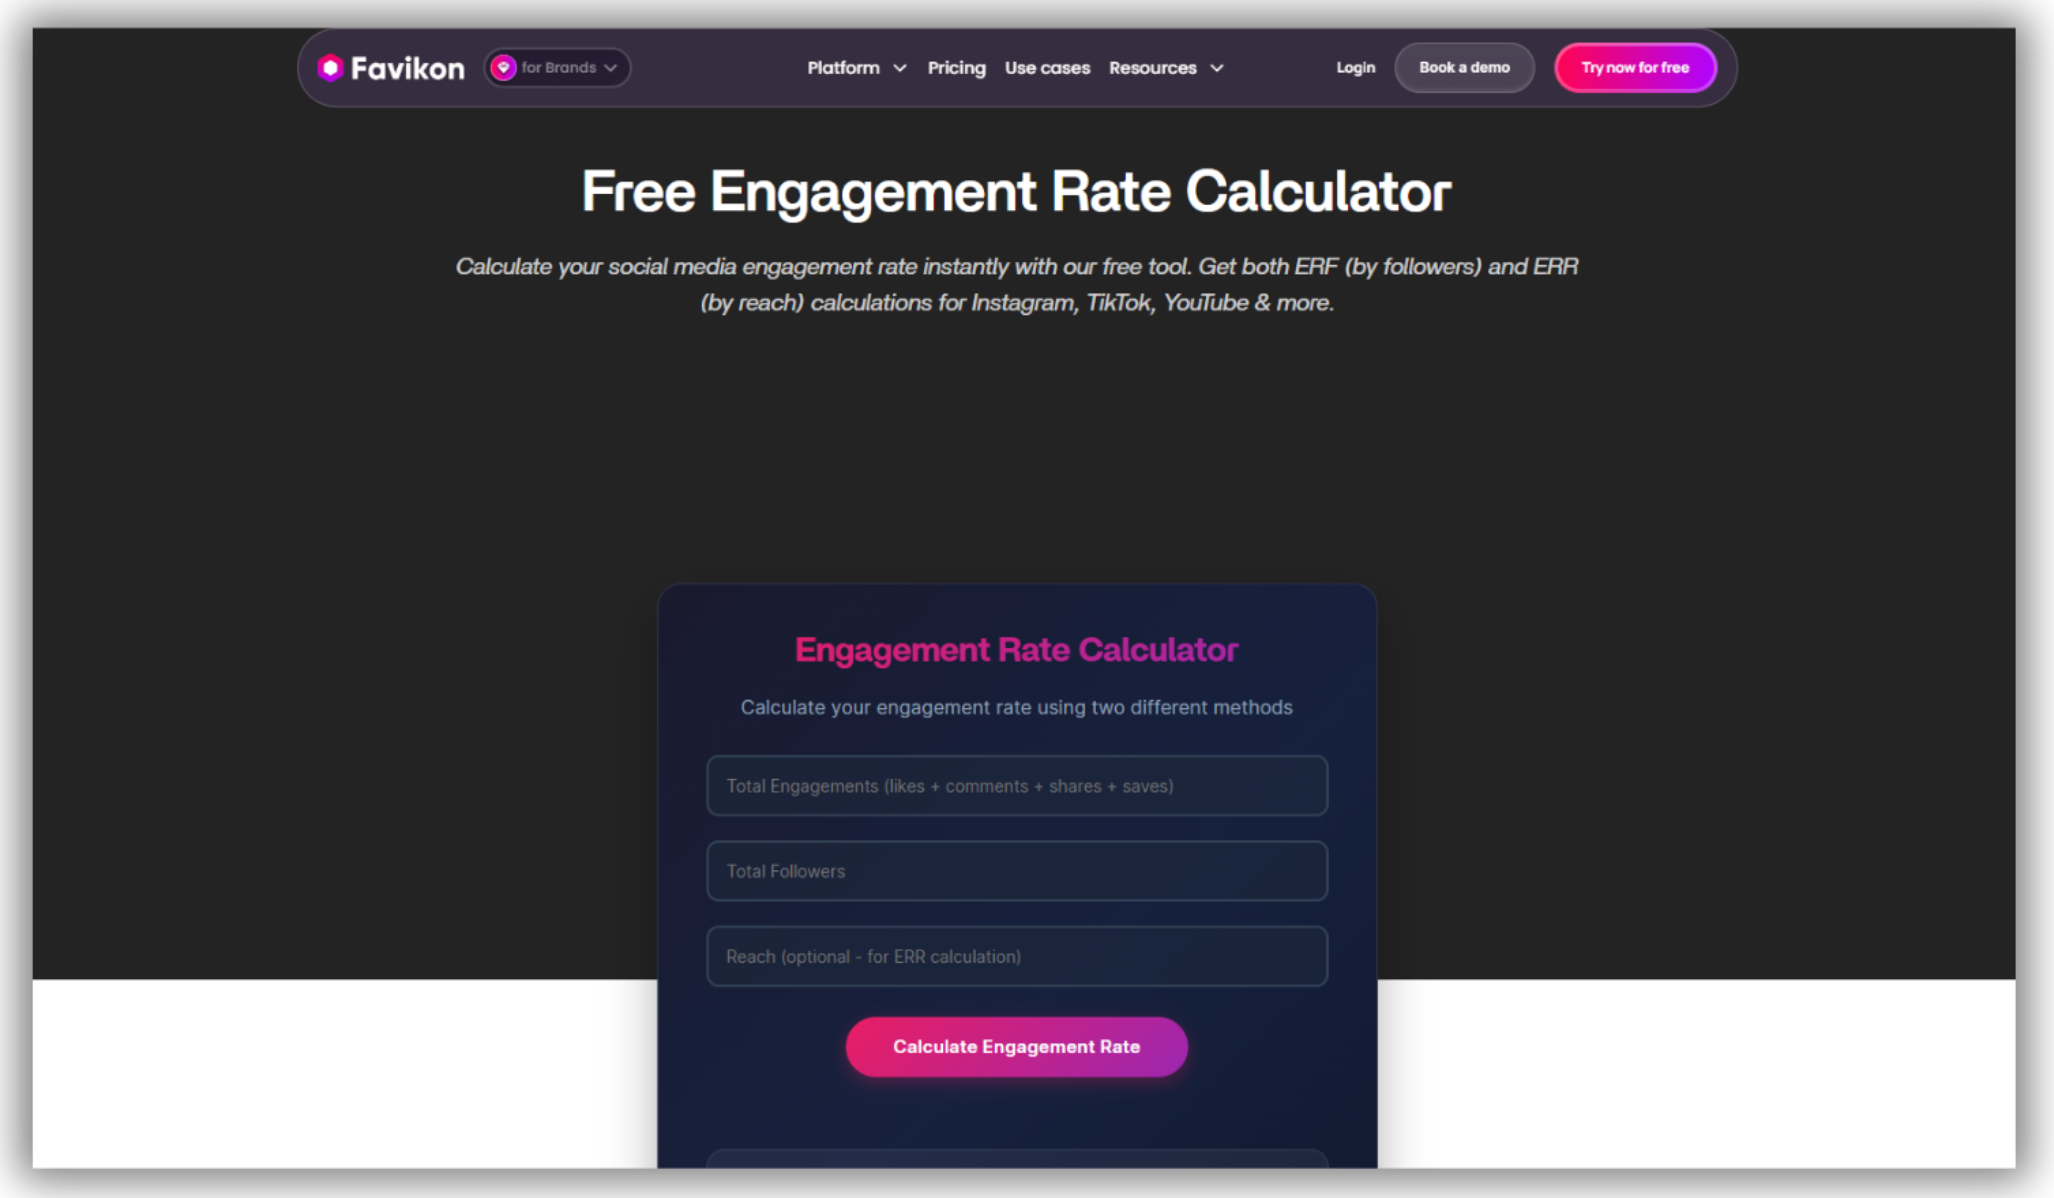
This is the fastest starting point for evaluating a creator from a media kit or a manual profile review. Paste in the figures from their most recent 5–10 posts, average the outputs, and you have a reliable baseline without building a spreadsheet.
Method 3: Manual Calculation
For public profiles where you want to spot-check without a tool:
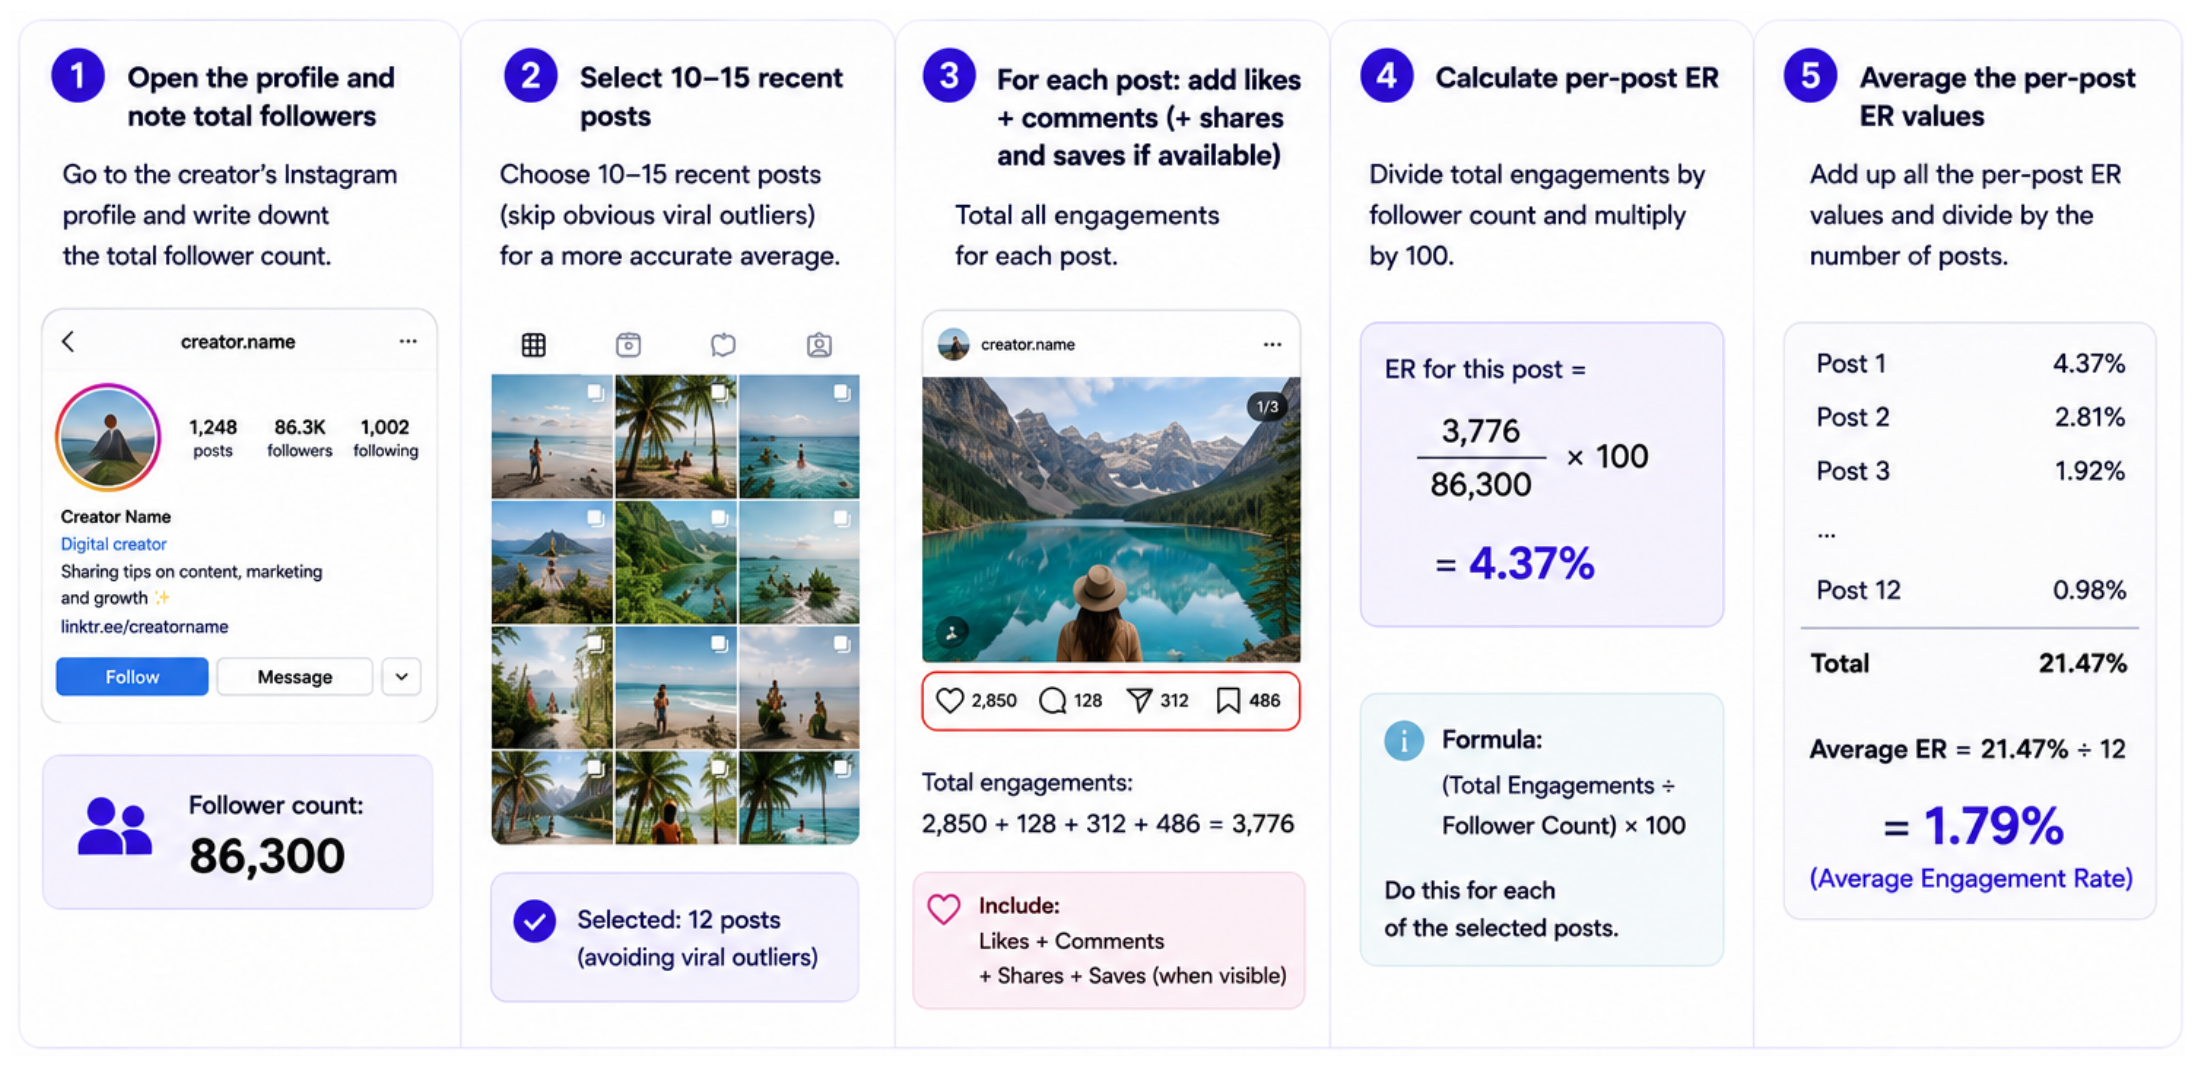
1. Open the creator's Instagram profile and note the total follower count
2. Select 10–15 recent posts, skipping obvious viral outliers
3. For each post: add likes + comments. Shares and saves are visible on some posts; include them when available
4. Divide the total engagements for each post by follower count and multiply by 100
5. Average the per-post ER values for a representative number
Manual calculation is fine for a handful of spot-checks, but it has three limitations: it can't detect inauthentic engagement, it provides no benchmark context, and it doesn't scale past a few profiles without becoming impractical.
6. How to Check Instagram ER in Favikon V3: Step-by-Step
1. Find the creator in Favikon
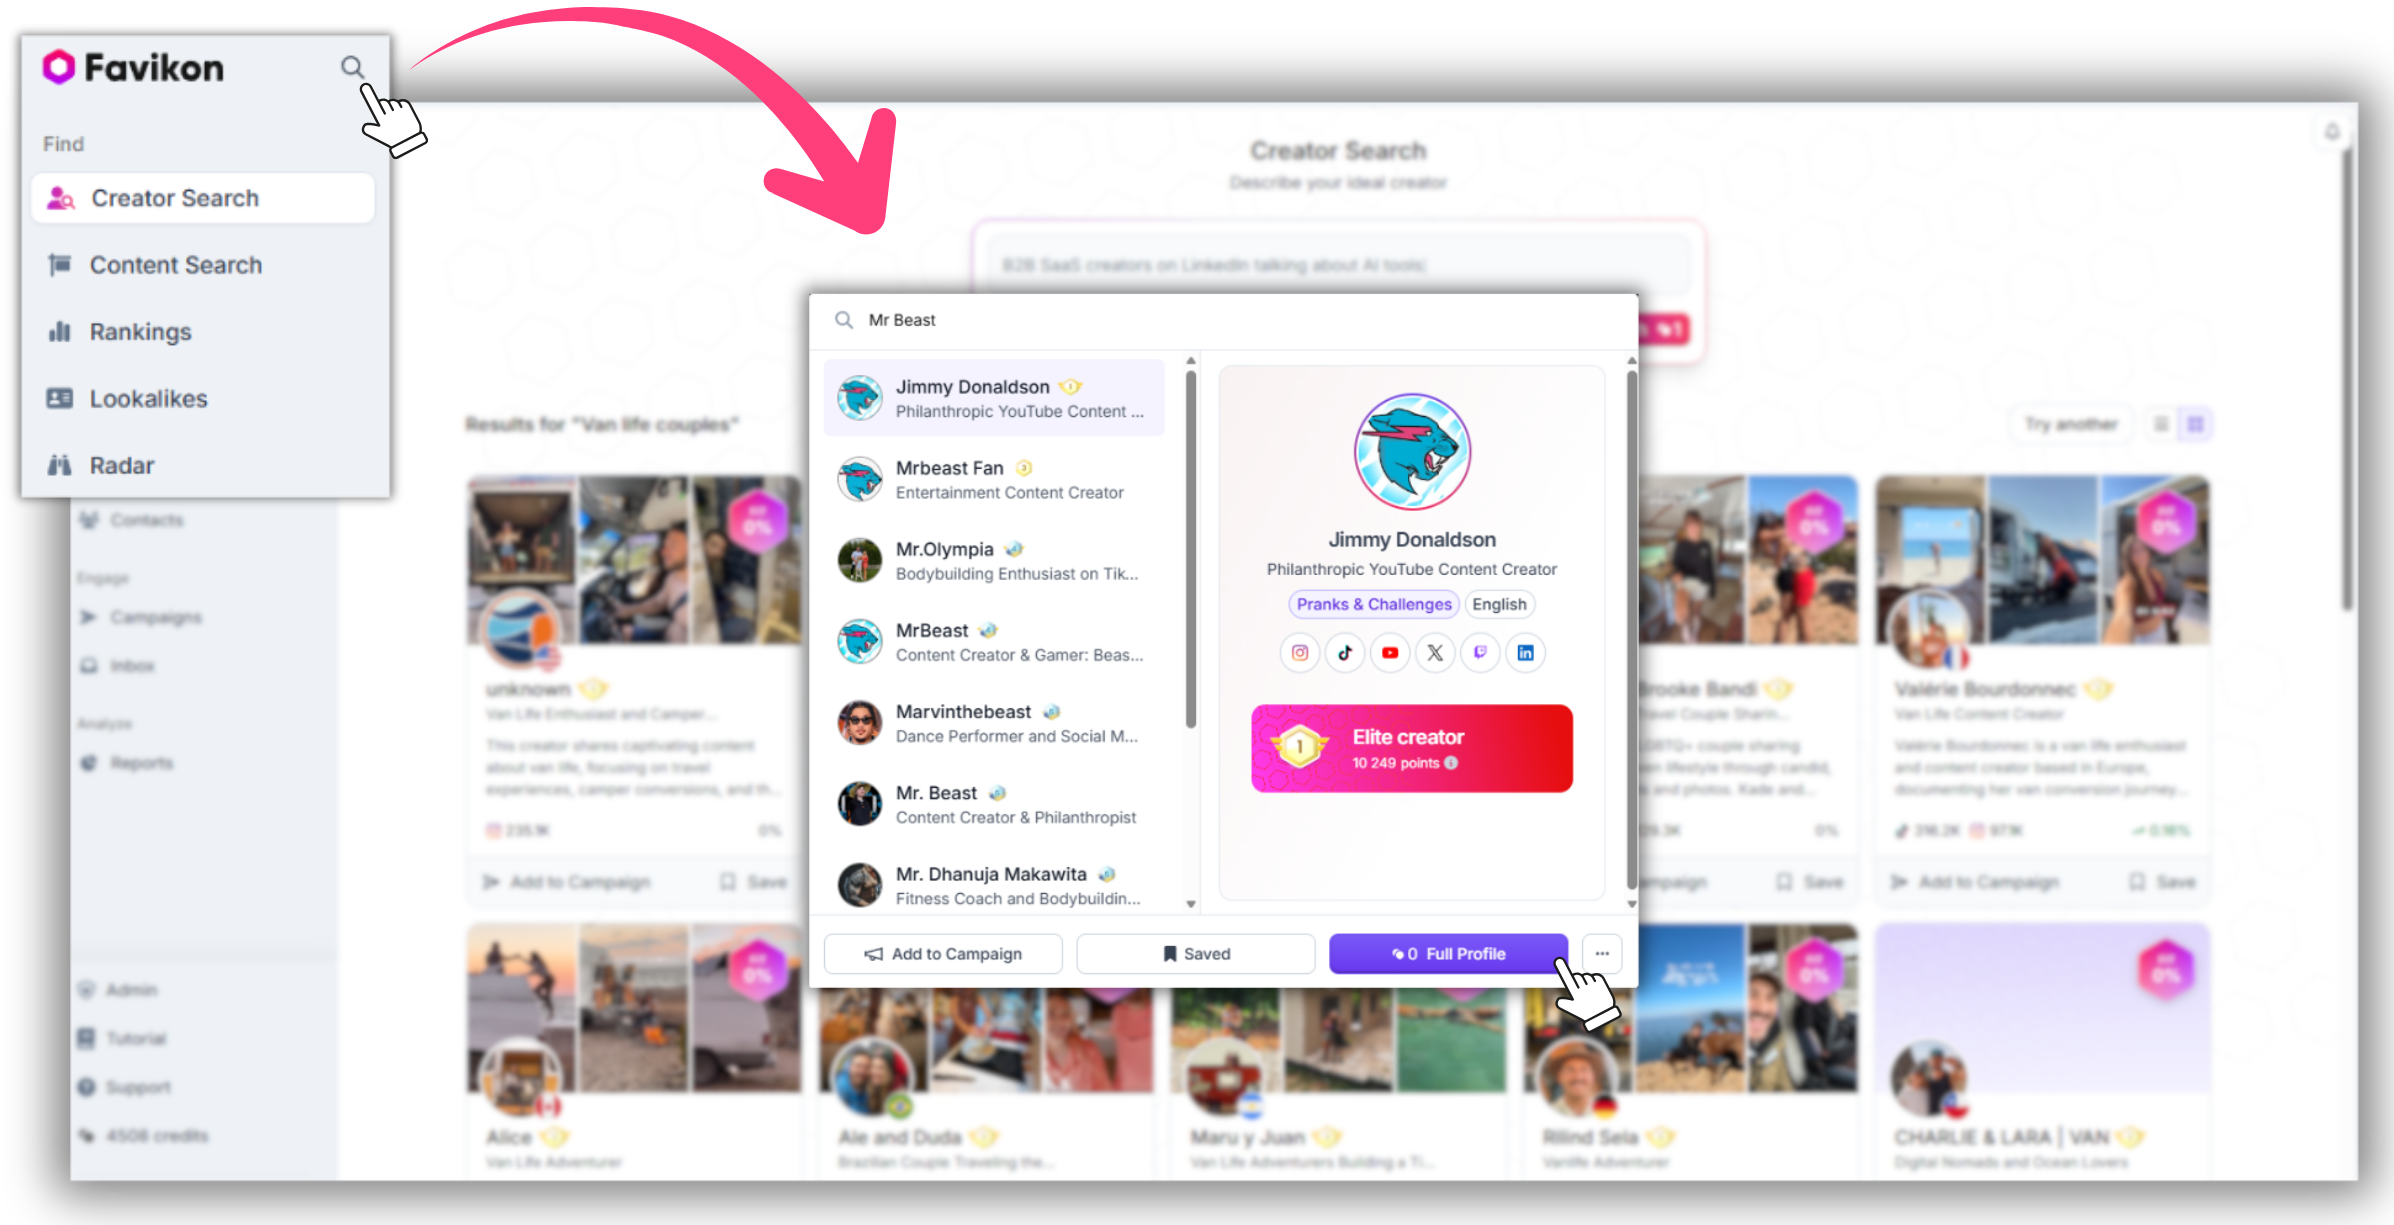
Search for the creator's name or handle in Favikon's Influencer Search Tool, or browse Instagram influencers by niche using Favikon's filtered discovery. Click into their profile to open the full analytics view.
2. Open the creator's profile
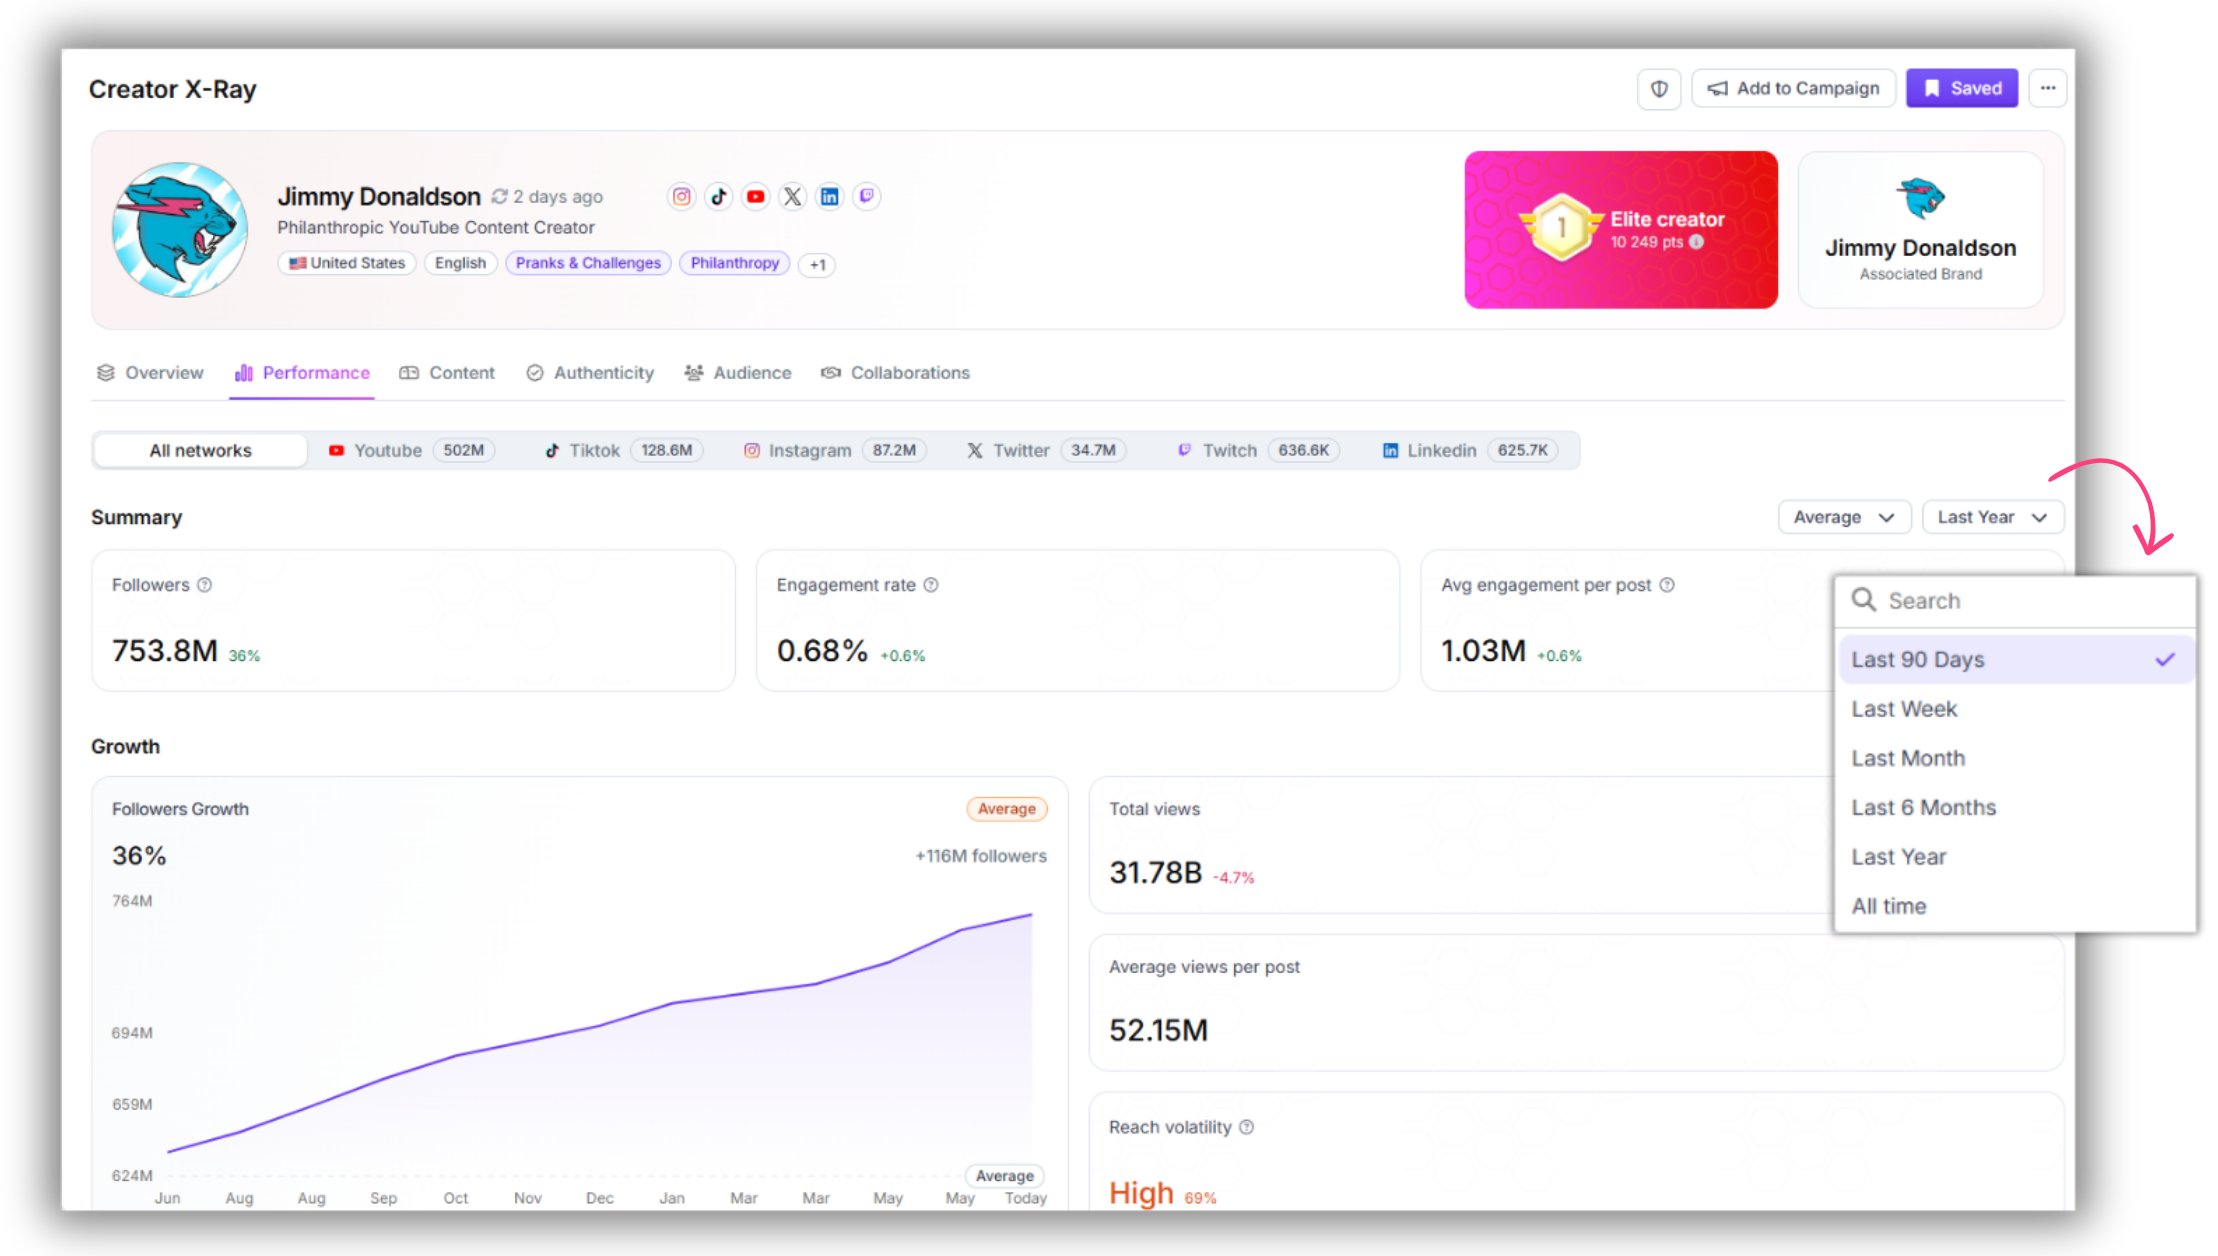
Click the creator's profile card to open their full analytics view. The engagement rate appears prominently on the overview tab, alongside follower count, posting frequency, and Favikon Score.
3. Review the 90-day ER trend
Open the trend chart and look at movement over 30 and 90 days. A declining ER trend over 90 days — even if the current number looks acceptable — signals audience fatigue, niche drift, or algorithmic demotion. A growing trend is a strong positive indicator even from a newer creator.
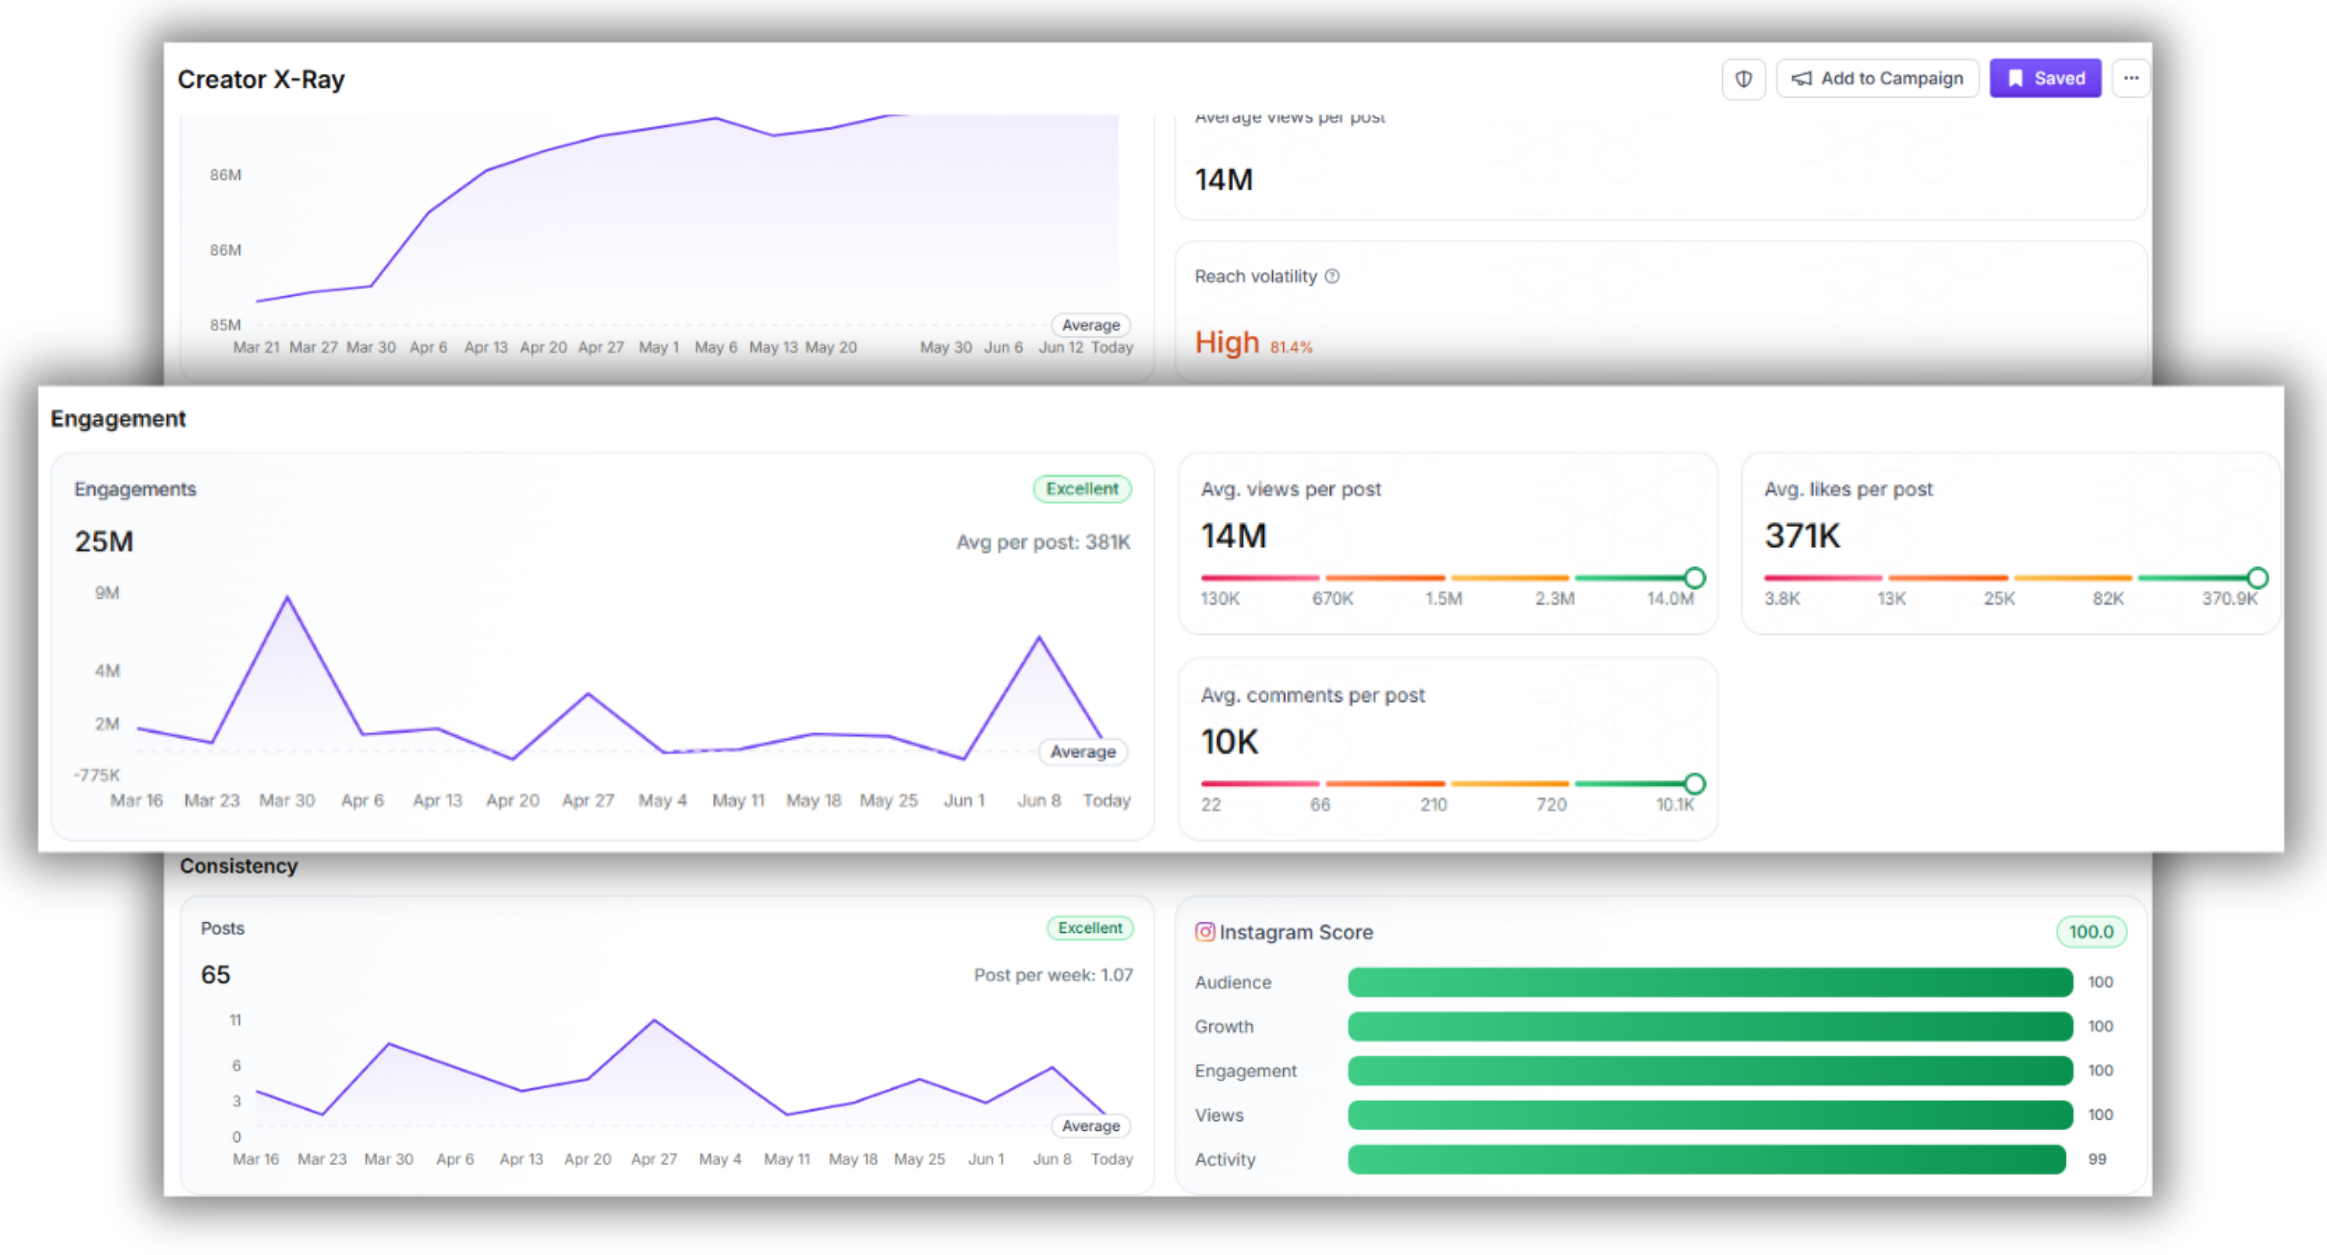
4. Check ER by content format
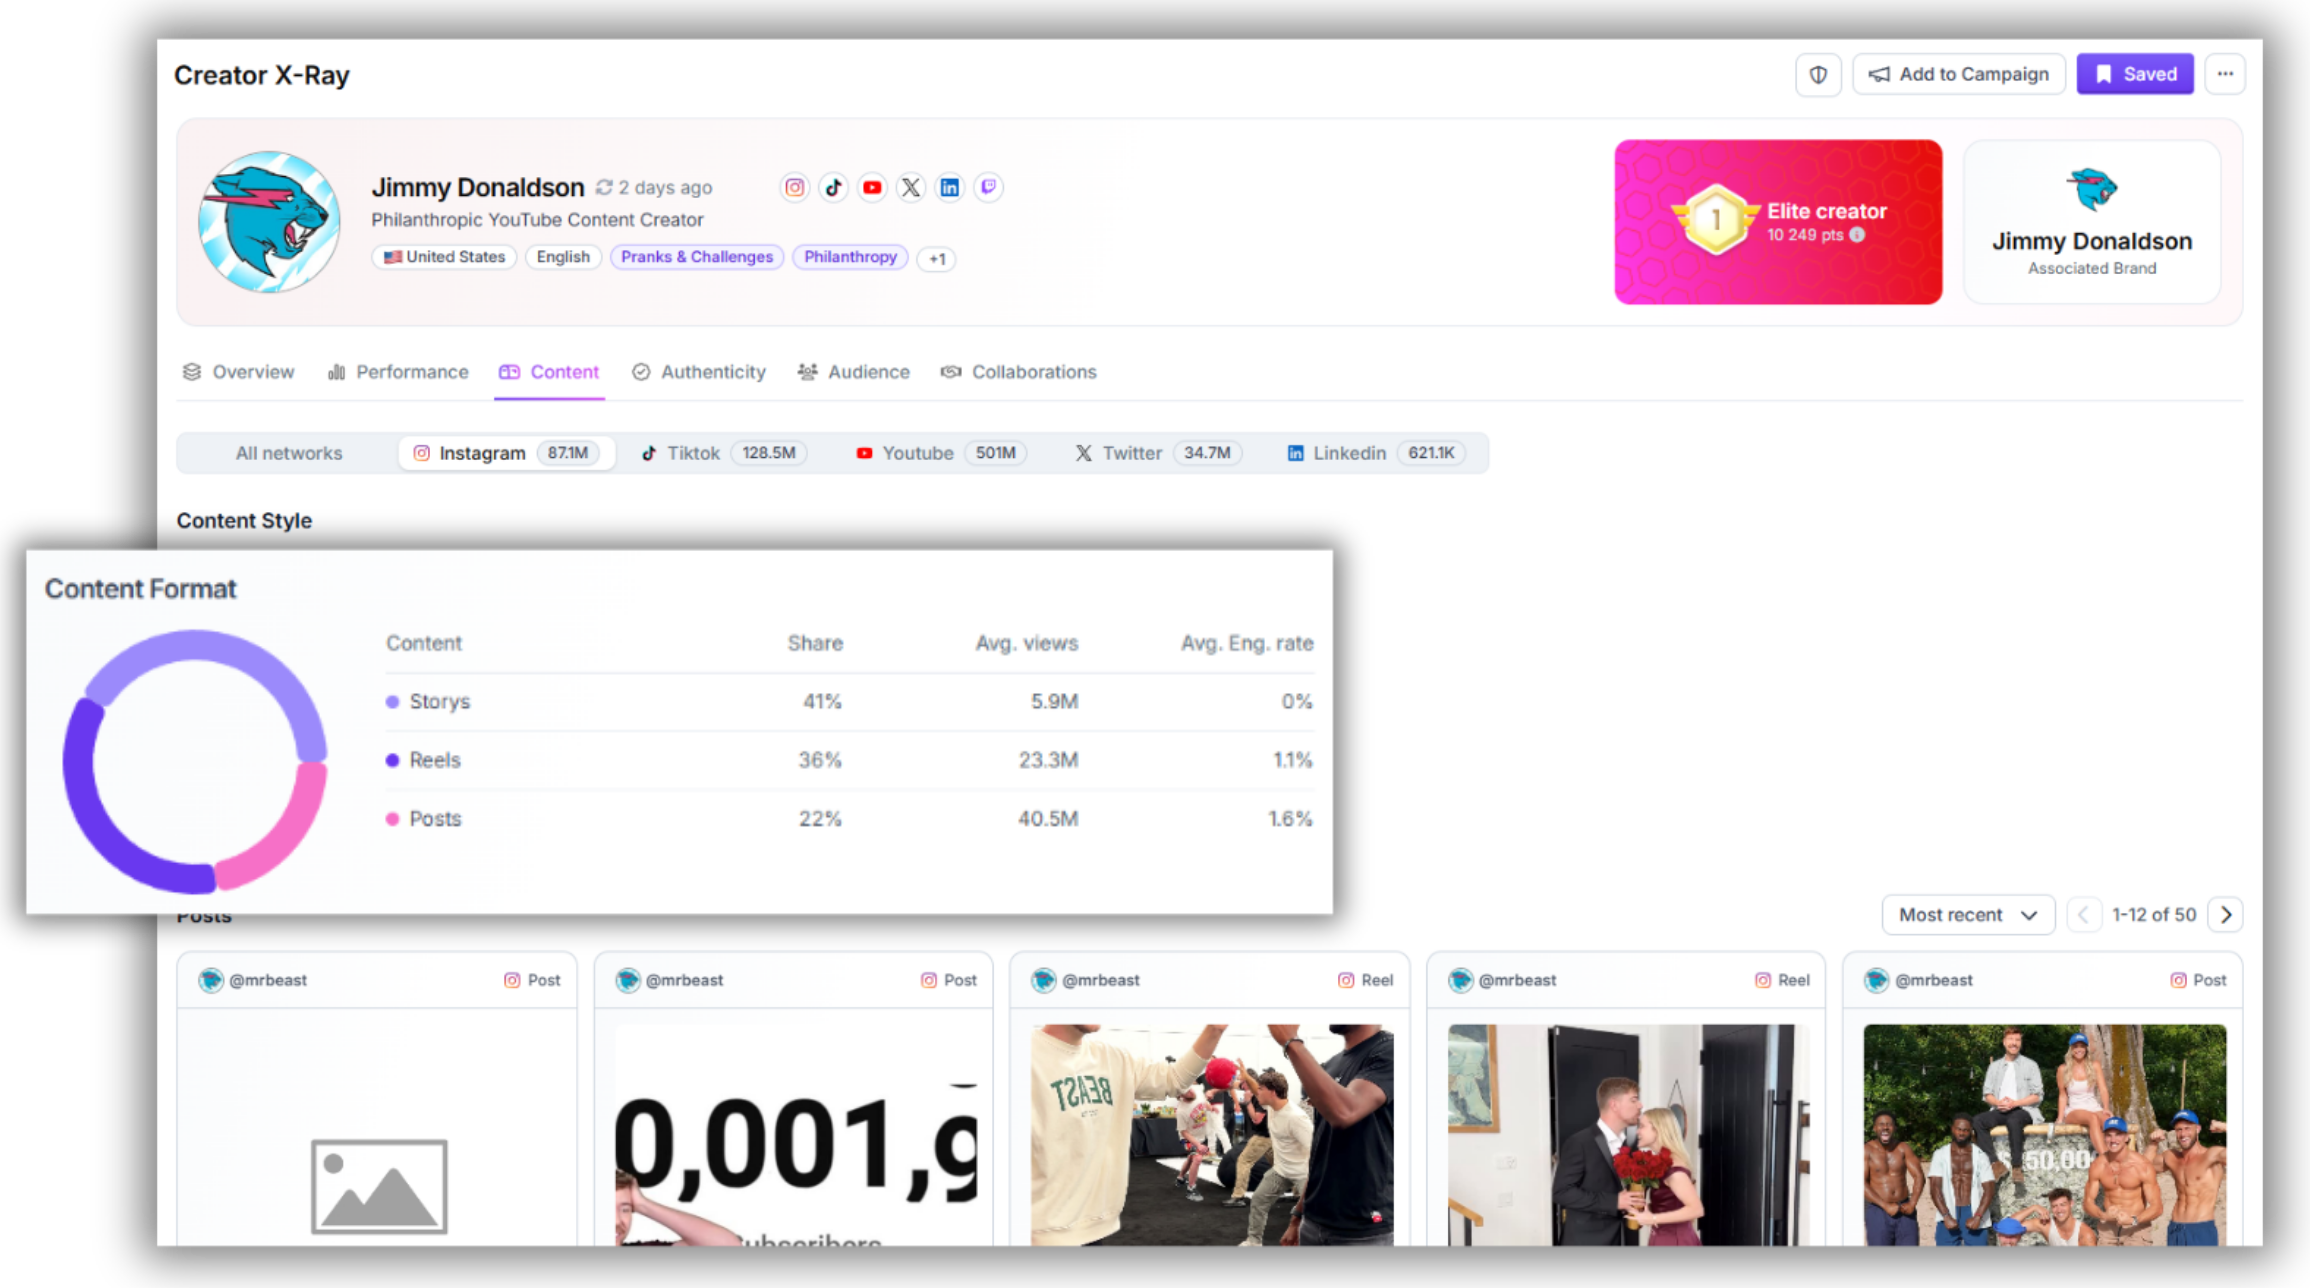
Scroll to the Posts tab and filter by format (Reels, carousels, static). A creator with strong Reels ER and weak static ER is a great fit for video-first campaigns, not flat lay product shots. Matching format-specific performance to your campaign type improves results significantly.
5. Cross-check with the authenticity score
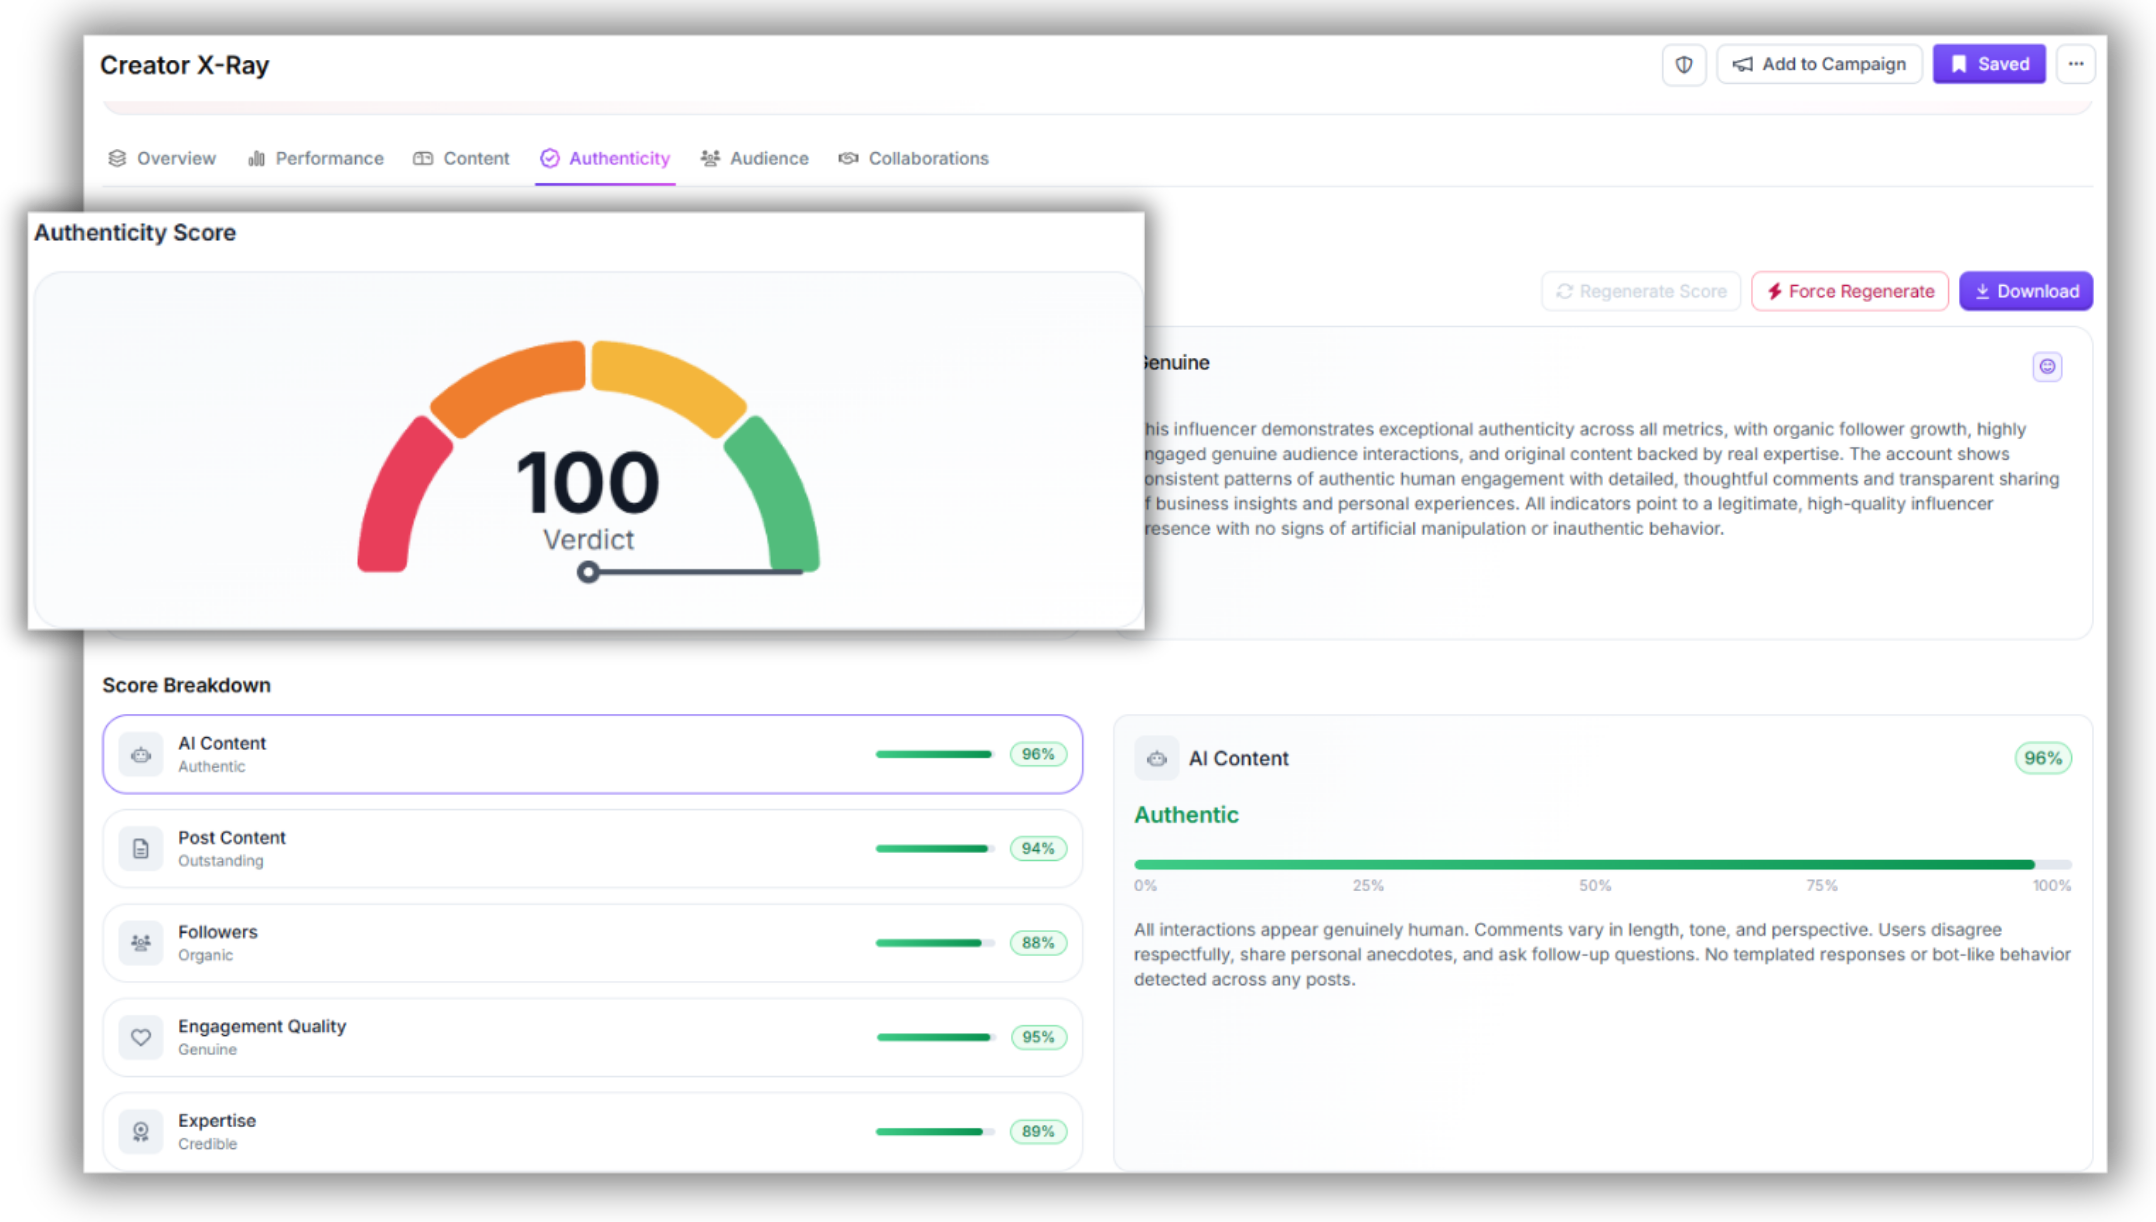
High ER paired with a low authenticity score is a red flag — it means the engagement is likely coming from pods, bots, or purchased interactions. Always read ER and authenticity score together. If you see a major discrepancy, run a deeper check using our fake follower guide.
6. Use Content Tracking for campaign-period analysis
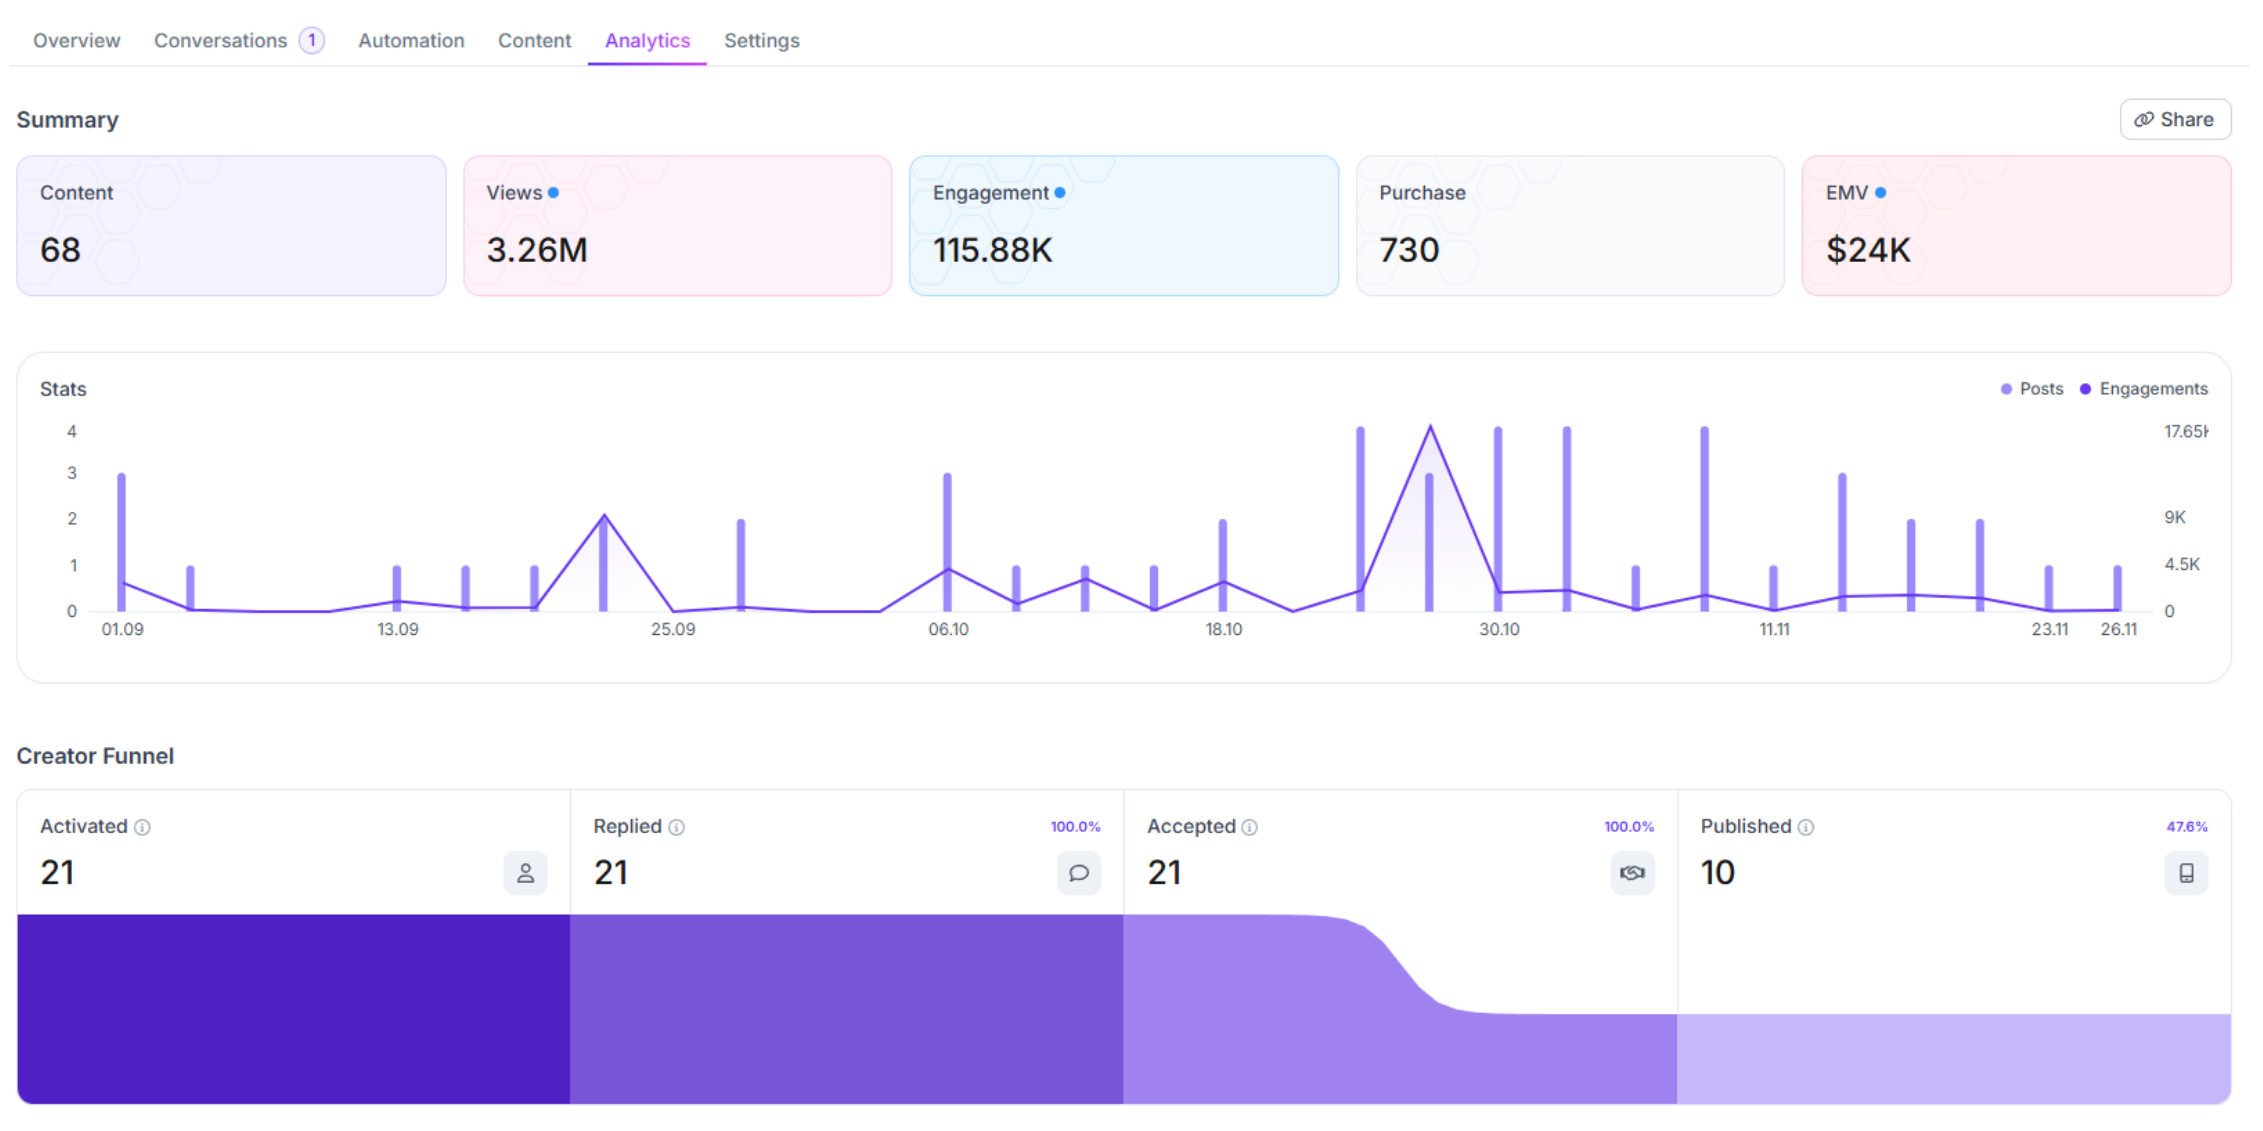
For creators you're considering for a specific campaign window, use Favikon V3's Content Tracking feature to set a custom date range (e.g., last 30 days, or a specific product launch period). This gives you ER data tied to real-world campaign timing rather than a rolling average that may include stale periods.
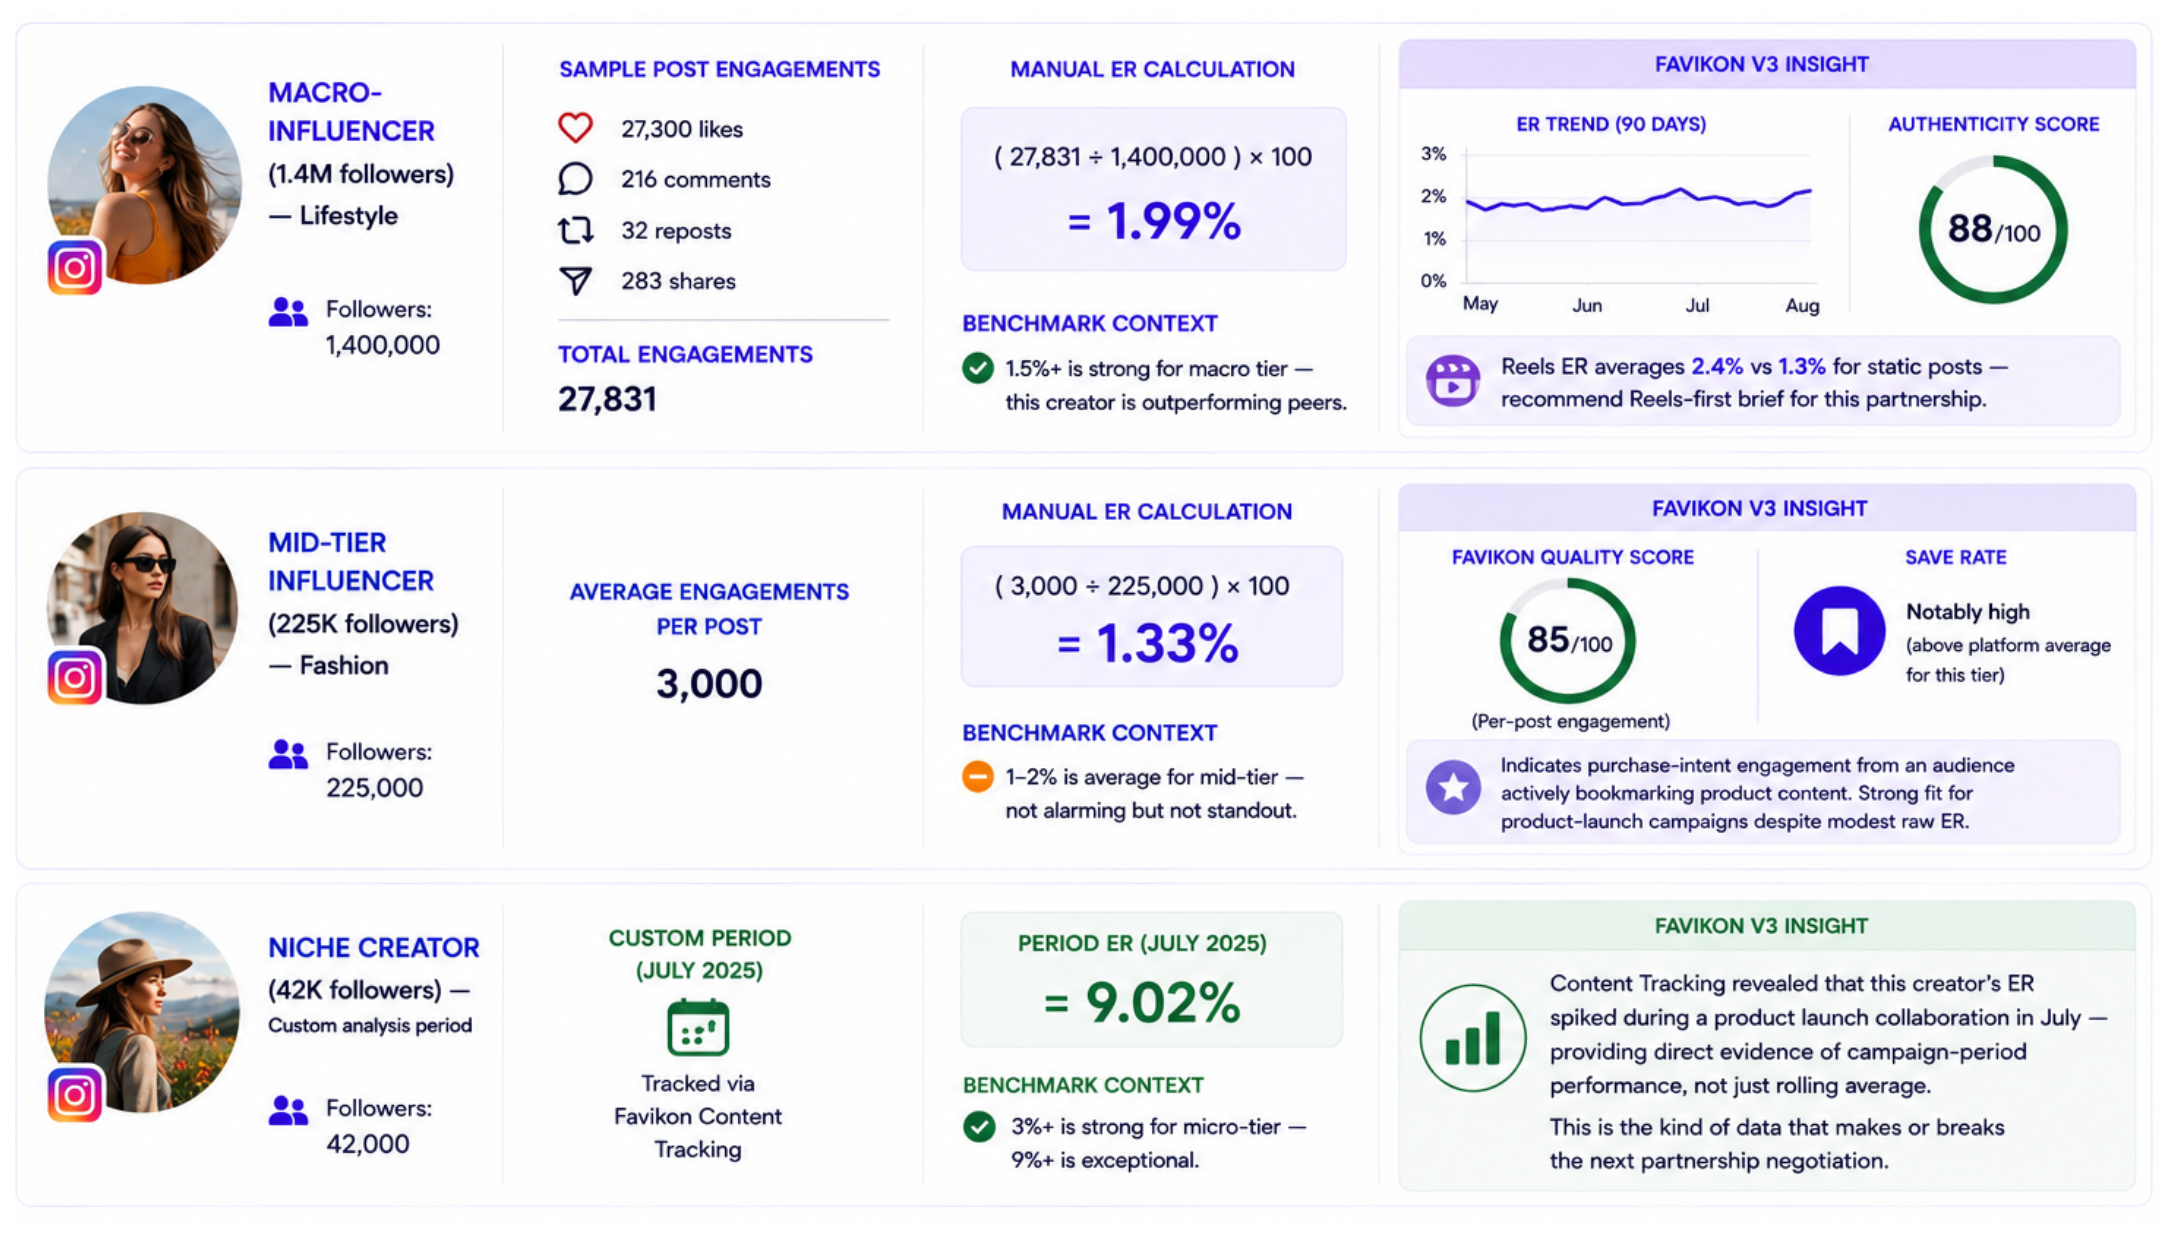
7. Instagram Engagement Rate in Practice: Three Creator Profiles
Here's how engagement rate evaluation plays out across three different creator profiles — the kind of analysis you'd run before any partnership decision.
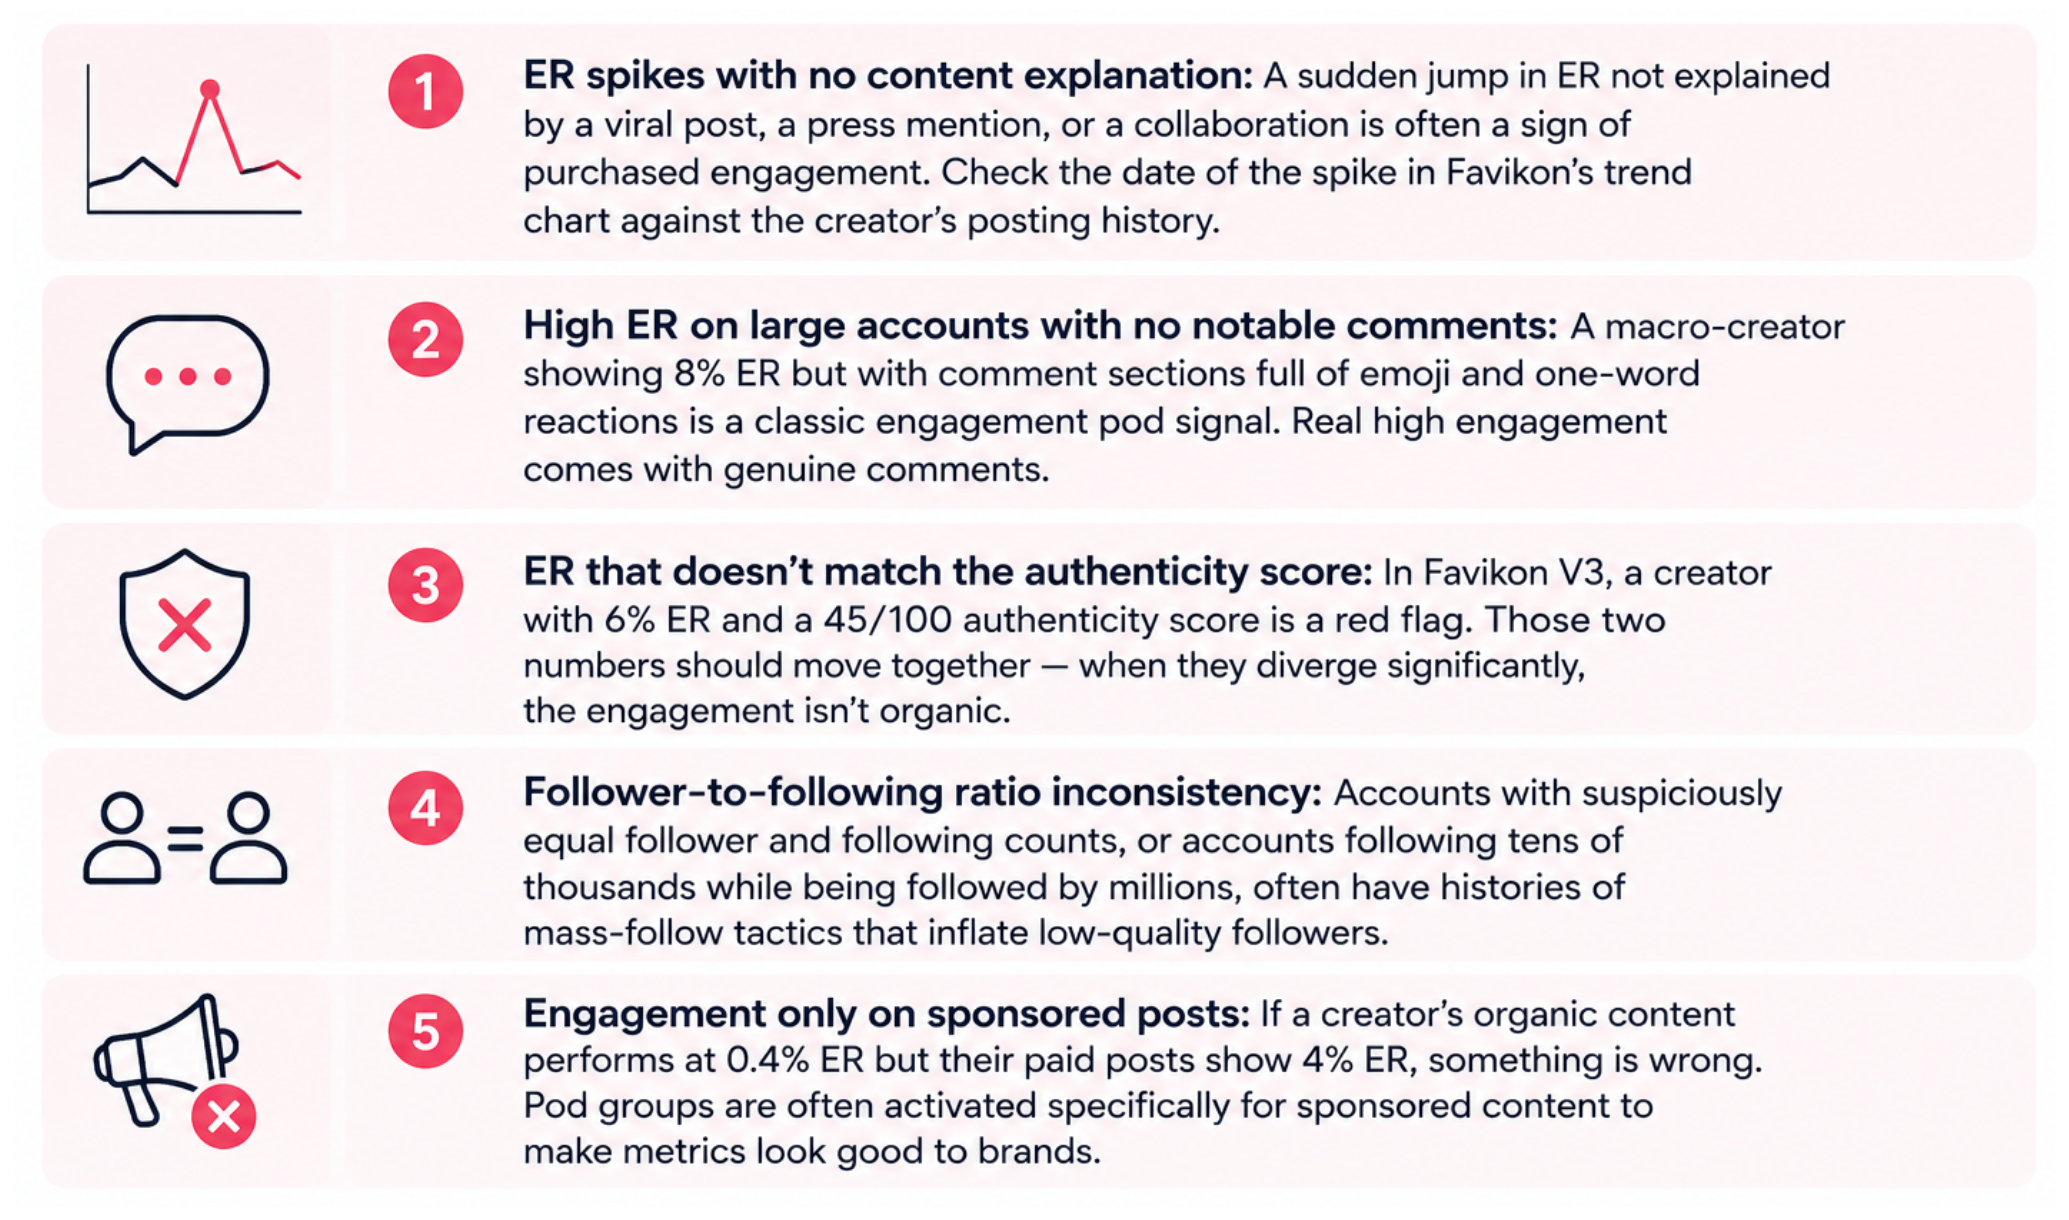
8. Red Flags: Spotting Inauthentic Instagram Engagement
High engagement rate is only valuable when the engagement is genuine. Here are the specific patterns that should trigger a deeper investigation before any partnership commitment.
9. Using Instagram ER to Make Partnership Decisions
High ER + High Save Rate → Product Launch Campaigns
A creator with above-average ER and a notably high save rate has an audience that is actively researching and bookmarking what they share. This is the strongest signal for campaigns where you want audience members to look something up, consider a purchase, or return to a piece of content. Prioritize this profile for product launches, limited-time offers, and consideration-stage campaigns.
Strong Reels ER + Broad Reach → Awareness Campaigns
A creator whose Reels consistently outperform their static content in both ER and reach is ideal for top-of-funnel awareness work. Their content is getting pushed beyond their existing audience by Instagram's algorithm, which means your campaign benefits from both their follower base and organic distribution to new viewers.
High Comment Quality + Consistent ER → Community Campaigns
When comment sections are filled with genuine questions, personal stories, and creator responses — even at a modest ER percentage — that signals deep community trust. This profile is the right fit for campaigns that benefit from word-of-mouth dynamics: referral programs, ambassador schemes, and any campaign where social proof among community members is part of the value chain.
When to Look Beyond ER
Engagement rate answers the question "does this creator's audience respond?" but it doesn't answer "are they the right audience?" Before finalizing any partnership, pair ER evaluation with audience demographics and psychographics analysis — age, location, gender split, brand affinity — to confirm that the responsive audience is also the target audience.
Conclusion
Instagram engagement rate is the most reliable starting point for any creator evaluation — but it has to be read in context. Context means: the right formula (follower-based for external vetting), comparison within the same creator tier, awareness of format-specific differences between Reels and carousels, and a parallel check on authenticity signals.
The fastest way to get all of that in one place is Favikon V3's analytics dashboard. Every creator profile shows ER, quartile ranking, trend data, format-level breakdowns, and an authenticity score — without manual calculation. Use the benchmark table in Section 4 to interpret what you find, and use the step-by-step workflow in Section 6 to make creator vetting a consistent, repeatable part of your campaign planning process.
FAQ: Instagram Engagement Rate
What is a good engagement rate on Instagram?
It depends on the creator's follower count. For nano-influencers (under 10K), 4%+ is strong. For micro-influencers (10K–100K), 3%+ is strong. For mid-tier creators (100K–500K), 2%+ stands out. For macro-creators (500K–1M), 1.5%+ is above average. For mega-influencers (1M+), anything above 1% is performing well. Never compare these numbers across tiers — the inverse relationship between size and ER is a structural feature of the platform.
What counts as engagement on Instagram?
For standard ER calculation, count likes, comments, shares (to Stories or DMs), and saves. Saves are unique to Instagram and represent the highest-intent engagement action on the platform — a save signals that a user found the content valuable enough to return to, making it the strongest conversion signal in the ER calculation.
Why do carousels have lower ER than Reels?
Carousels receive less algorithmic push than Reels, so they reach fewer people overall — which reduces raw engagement volume. However, carousels generate the highest save rates of any Instagram format because they tend to contain information users want to reference later (tutorials, tips, multi-image product showcases). For purchase-intent campaigns, carousel save rate is often a more useful metric than raw ER.
How do I check engagement rate without manual calculation?
Use Favikon's free Engagement Rate Calculator for quick one-off calculations, or open any creator's profile in Favikon's analytics platform to see ER calculated automatically alongside quartile ranking, trend data, and authenticity scores. The Favikon Chrome Extension surfaces this data directly on an influencer's Instagram profile page without requiring you to switch platforms.
Can a high Instagram engagement rate be faked?
Yes — through engagement pods (creator groups that systematically like and comment on each other's content), purchased likes, or bot activity. In Favikon V3, a high ER paired with a low authenticity score is the clearest indicator. Comment quality is also a useful manual signal — real engagement produces specific, personal comments; inauthentic engagement produces generic reactions. See the full detection guide at our fake follower article.
Should I evaluate ER differently for Reels vs. feed posts?
Yes. Reels benefit from algorithmic distribution beyond existing followers, which means ER calculated against follower count can appear lower than for feed posts that only reach followers. For Reels, pay attention to absolute engagement volume and whether ER is above the format average for the creator's tier. For carousels and static posts, focus on save rate as a secondary metric alongside raw ER. Favikon V3's per-post breakdown lets you filter by format to make this comparison cleanly.
Also See 👀
🏆 HOW TO DO INFLUENCER OUTREACH WITHOUT SOUNDING LIKE A BOT
🏆 HOW TO CALCULATE ENGAGEMENT RATE OF ANY CREATOR
HOW DOES FAVIKON RANK INFLUENCERS?
Related Articles
See all the articles
.webp)
.webp)


